My first blog post was a guest post
August 30, 2016 Etc PVA publications Hungary
The title says it all. I wrote this piece about Publication Viability Analysis pondering about a pattern that I observed while looking at Hungarian ecologists publication output through time using the Web of Science database (the original post is in Hungarian).
I fit Ricker growth model to observed publication numbers and a non-stationary 2-phase model was the best fit. An intrinsic growth rate of 0.39 with carrying capacity K = 14 publications per year was characteristic to the pre-democracy (Soviet occupation era) phase (1978–1997). The democratic era (1998–2012) showed growth rate of 0.21 with a much higher K = 100 (variance went from 0.44 to 0.03).
The motivation for the analysis and post was that the number of publications has been persistently around K = 100 for 5 years. So I looked at the correlation between the number of PhD students and the number of publications, using different lag times between 0 and 10 years. The correlation was highest for a 7-year lag. This more or less indicates a cohort of PhD students (myself included) who started PhD around 2000.
This cohort represents the grandchildren of the post-WWII boom, births have declined after this cohort – therefore less PhD students to produce papers. If this is true, it also means that it takes considerable time for PhD students to reach peak publication productivity. So I proposed to shorten the lag to 3–5 years to boost publication numbers. Win for the students and win for Hungary.
Why am I bringing this old post up 3 years later? Because I wanted to
see how well my estimates have held up from a short-term forecasting
standpoint. Well, here are the results of a recent query with identical
settings (ADDRESS=HUNGARY; CATEGORIES=ECOLOGY) for the years 2013–2015:
| Year | Count |
|---|---|
| 2013 | 87 |
| 2014 | 114 |
| 2015 | 108 |
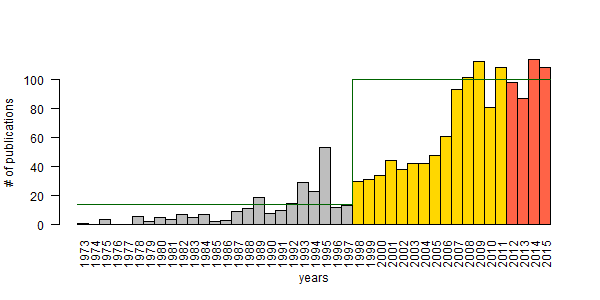
The figure shows the two phases used in modeling (grey and gold), and the forecast (tomato) with horizontal lines for carrying capacity. I wish these numbers have improved, but it is what it is. You can’t argue with science. In case you want to argue, just leave a comment!
Closing the gap between data and decision making
Analyzing Ecological Data with Detection Error
This course is for researchers who analyze field observations. These data are often inconsistent because sampling protocols can change across projects, over time, or when older data are combined with new recordings.
ABMI (7) ARU (1) Alberta (1) BAM (1) C (1) CRAN (1) Hungary (2) JOSM (2) MCMC (2) PVA (2) PVAClone (1) QPAD (3) R (21) R packages (1) abundance (1) bioacoustics (1) biodiversity (1) birds (2) course (2) data (1) data cloning (4) datacloning (1) dclone (3) density (1) dependencies (1) detect (3) detectability (4) footprint (3) forecasting (1) functions (3) intrval (4) lhreg (1) mefa4 (1) monitoring (2) pbapply (5) phylogeny (1) plyr (1) poster (2) processing time (2) progress bar (4) publications (2) report (1) sector effects (1) shiny (1) single visit (1) site (1) slider (1) slides (2) special (3) species (1) trend (1) tutorials (2) video (4) workshop (2)