Growth difference
edma_gdm.RdGrowth matrix and growth difference matrix based inference based on Lele and Richtsmeier (1992, 1995).
Usage
edma_gm(a1, a2, ...)
get_gm(object, ...)
# S3 method for edma_gm
get_gm(object, sort=FALSE, level=0.95,
    what="all", ...)

edma_gdm(a1, a2, b1, b2, ...)
get_gdm(object, ...)
# S3 method for edma_gdm
get_gdm(object, sort=FALSE, level=0.95,
    what="all", ...)

# S3 method for edma_gm
print(x, ...)
# S3 method for edma_gdm
print(x, ...)
# S3 method for edma_gm
global_test(object, ...)
# S3 method for edma_gdm
global_test(object, ...)
# S3 method for edma_gdm
landmarks(x, ...)
# S3 method for edma_gdm
dimensions(x, ...)

# S3 method for edma_gdm
plot_ord(x, ...)
# S3 method for edma_gdm
plot_clust(x, ...)
Arguments
- a1, a2, b1, b2
EDMA fit object to compare growths.
- x, object
an EDMA GM or GDM objects.
- sort
logical, if stacked distances are to be sorted, see Examples.
- level
numeric, between 0 and 1, alpha level for confidence interval.
- what
what part of the ford differences to return:
"all","less"or"greater"than 1,"signif"or"nonsignif".- ...
other arguments passed to
edma_fdm, likeref_denom.
Details
Growth matrix (GM) is calculated as the ratio of form matrices (FM) from the numerator and denominator objects following Lele and Richtsmeier (1992, 1995): GM(A1,A2) = FM(A2)/FM(A1). Form matrices are formed as pairwise Euclidean distances between landmarks from EDMA fit objects using the estimated mean forms.
Growth difference matrix (GDM) is calculated as GDM(A1,A2,B1,B2) = GM(B1,B2) / GM(A1,A2).
Inference and visualization is similar to how it is done for FDMs.
Value
edma_gm compares two EDMA fit objects and calculates GM.
edma_gdm compares 4 EDMA fit objects and calculates GDM.
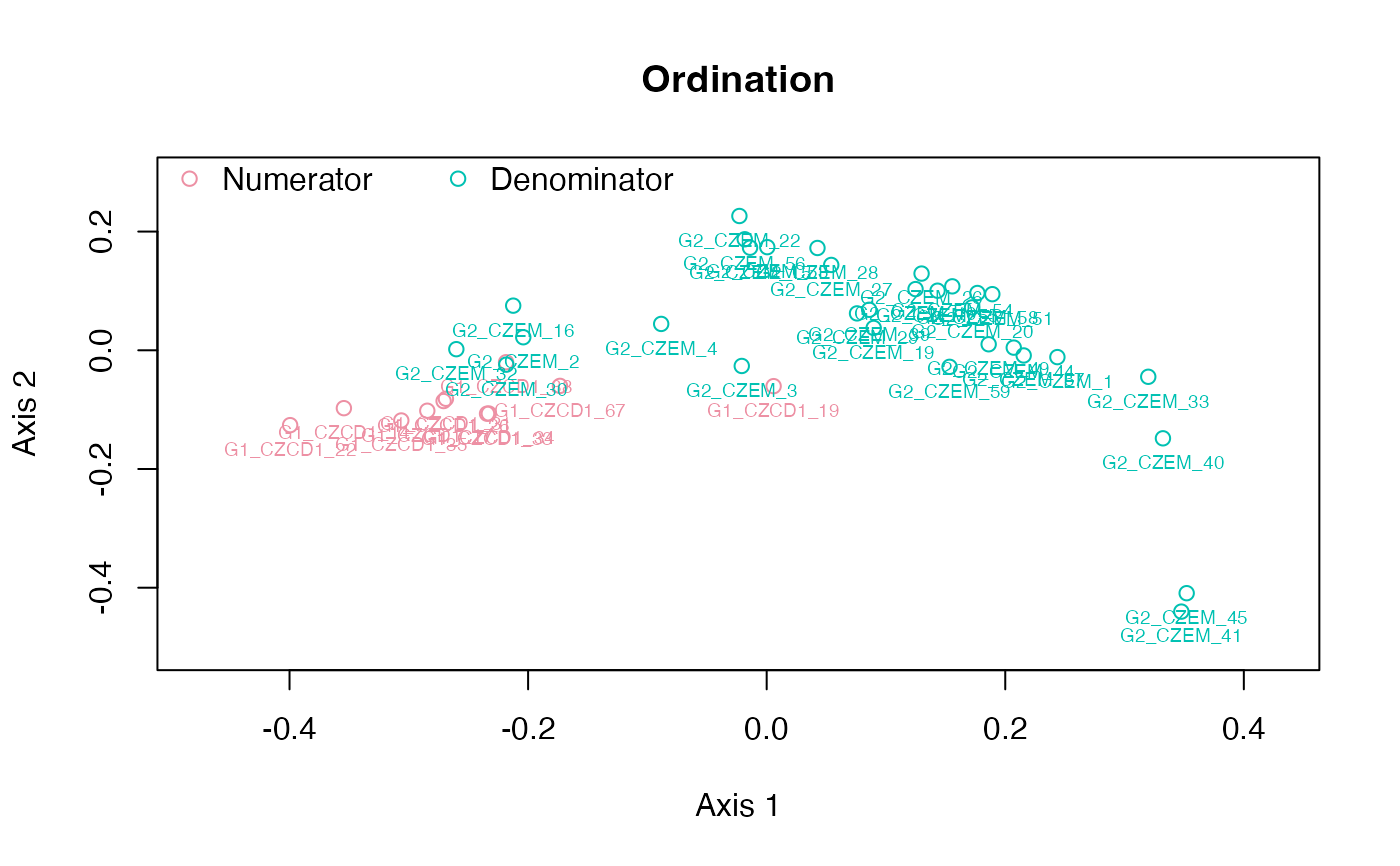
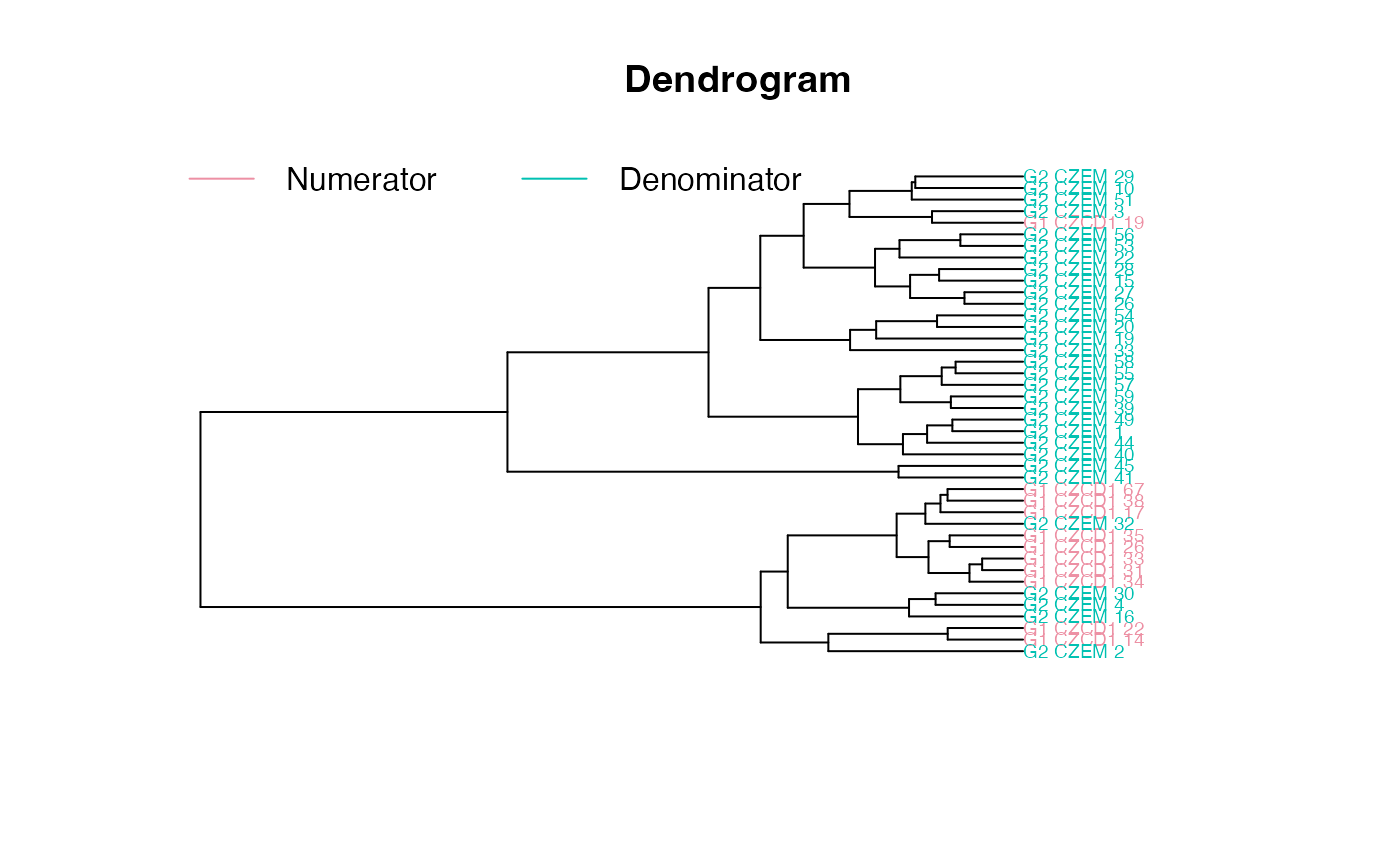
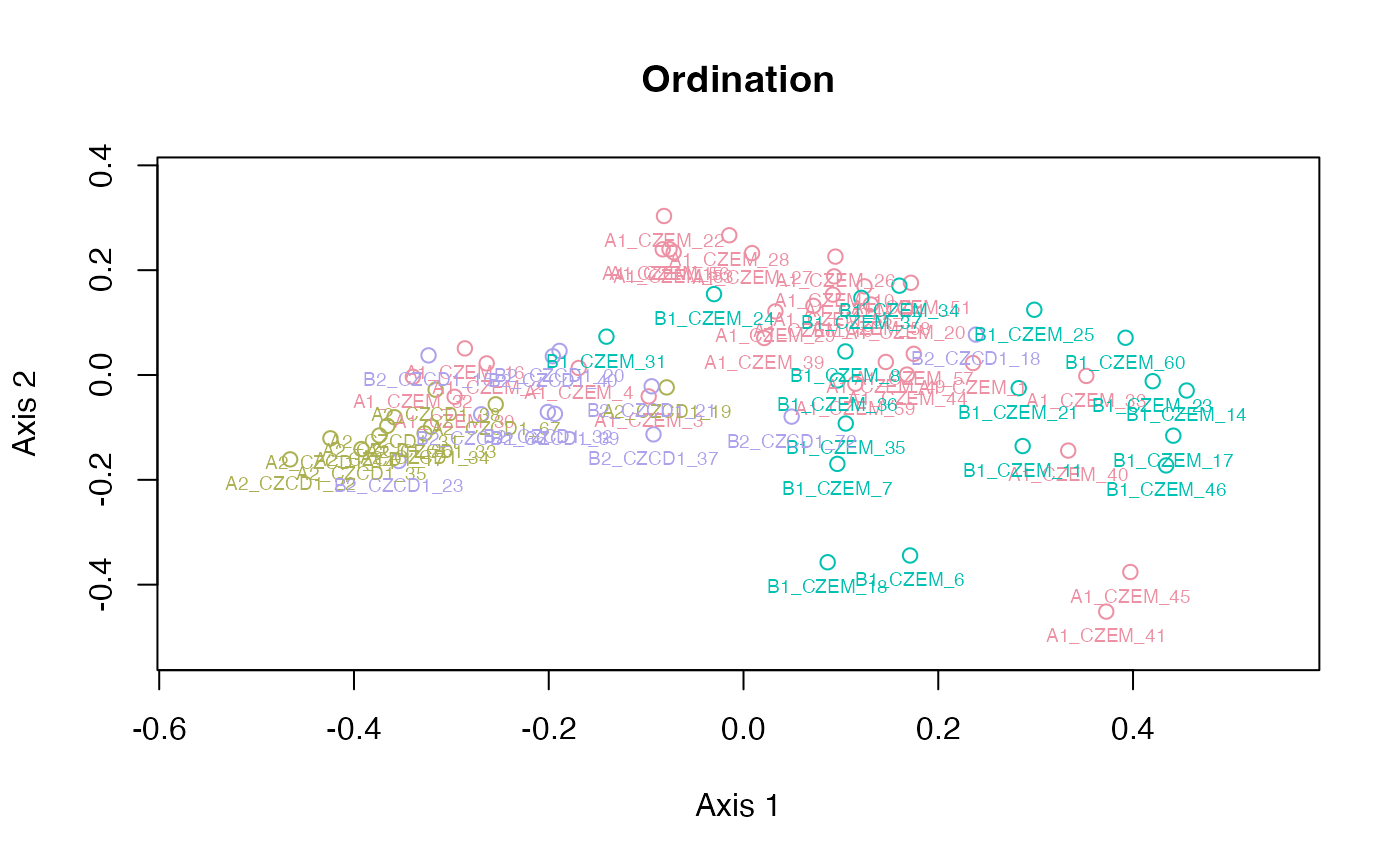
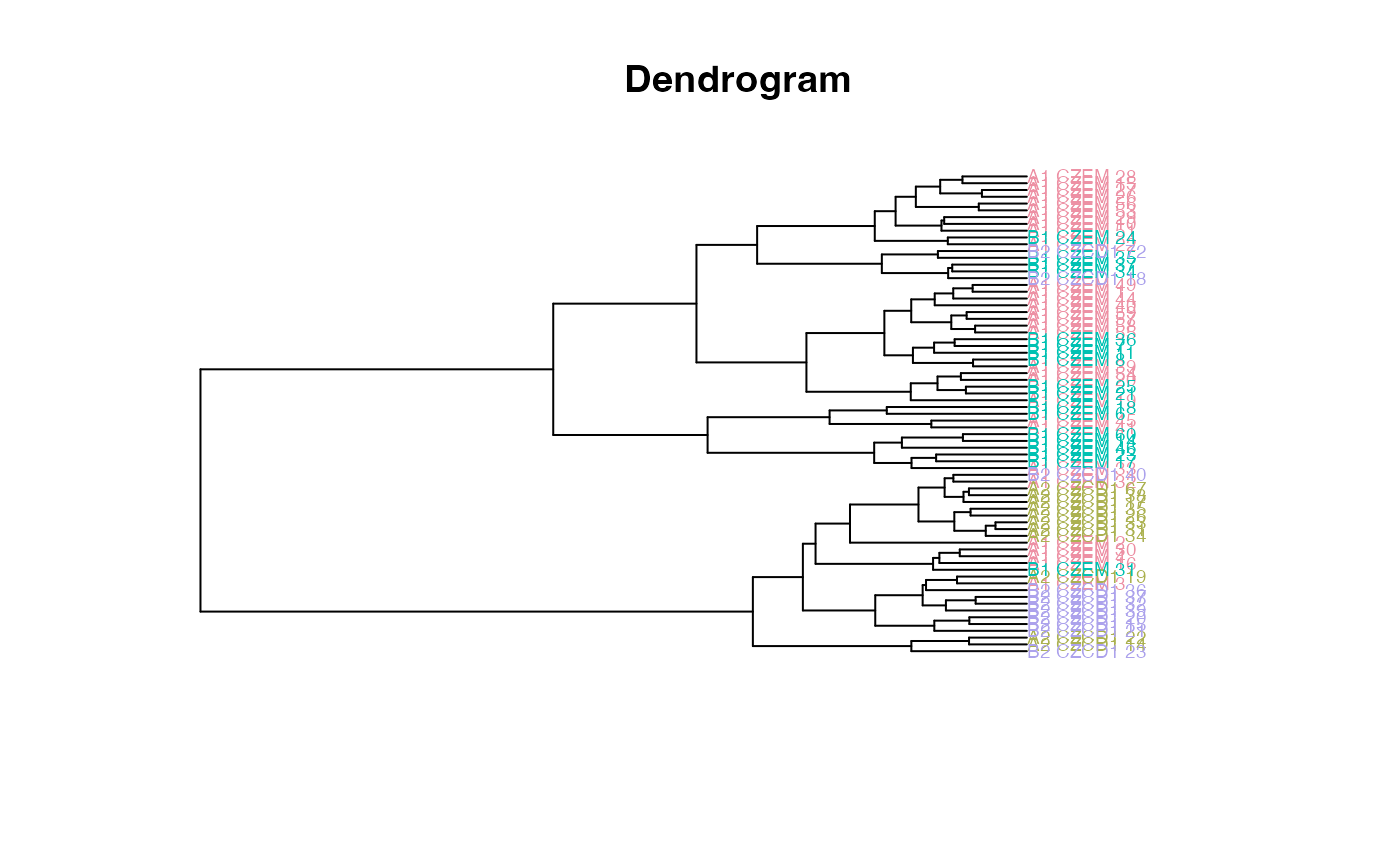
The plot_ord and plot_clust
produce plots based on dissimilarities among specimens in the 2 or 4 objects (for GM and GDM, respectively).
References
Lele, S. R., and Richtsmeier, J. T., 1992. On comparing biological shapes: detection of influential landmarks. American Journal of Physical Anthropology 87:49--65. <doi:10.1002/ajpa.1330870106>
Lele, S. R., and Richtsmeier, J. T., 1995. Euclidean distance matrix analysis: confidence intervals for form and growth differences. American Journal of Physical Anthropology 98:73--86. <doi:10.1002/ajpa.1330980107>
Examples
file_a1 <- system.file("extdata/growth/CZEM_wt_global.xyz",
package="EDMAinR")
file_a2 <- system.file("extdata/growth/CZP0_wt_global.xyz",
package="EDMAinR")
l <- c("amsph", "bas", "loci", "lpto", "lsqu",
"lsyn", "roci", "rpto", "rsqu", "rsyn")
a1 <- read_xyz(file_a1)[l,,]
a2 <- read_xyz(file_a2)[l,,]
a1
#> EDMA data: Crouzon unaffected embryonic mouse
#> 10 landmarks, 3 dimensions, 31 specimens
a2
#> EDMA data: Crouzon unaffected newborn mouse
#> 10 landmarks, 3 dimensions, 11 specimens
fit_a1 <- edma_fit(a1, B=10)
fit_a2 <- edma_fit(a2, B=10)
## --- growth matrix ---
gm <- edma_gm(a1=fit_a1, a2=fit_a2, B=10)
gm
#> EDMA growth matrix
#> Call: edma_gm(a1 = fit_a1, a2 = fit_a2, B = 10)
#> 10 bootstrap runs (ref: denominator)
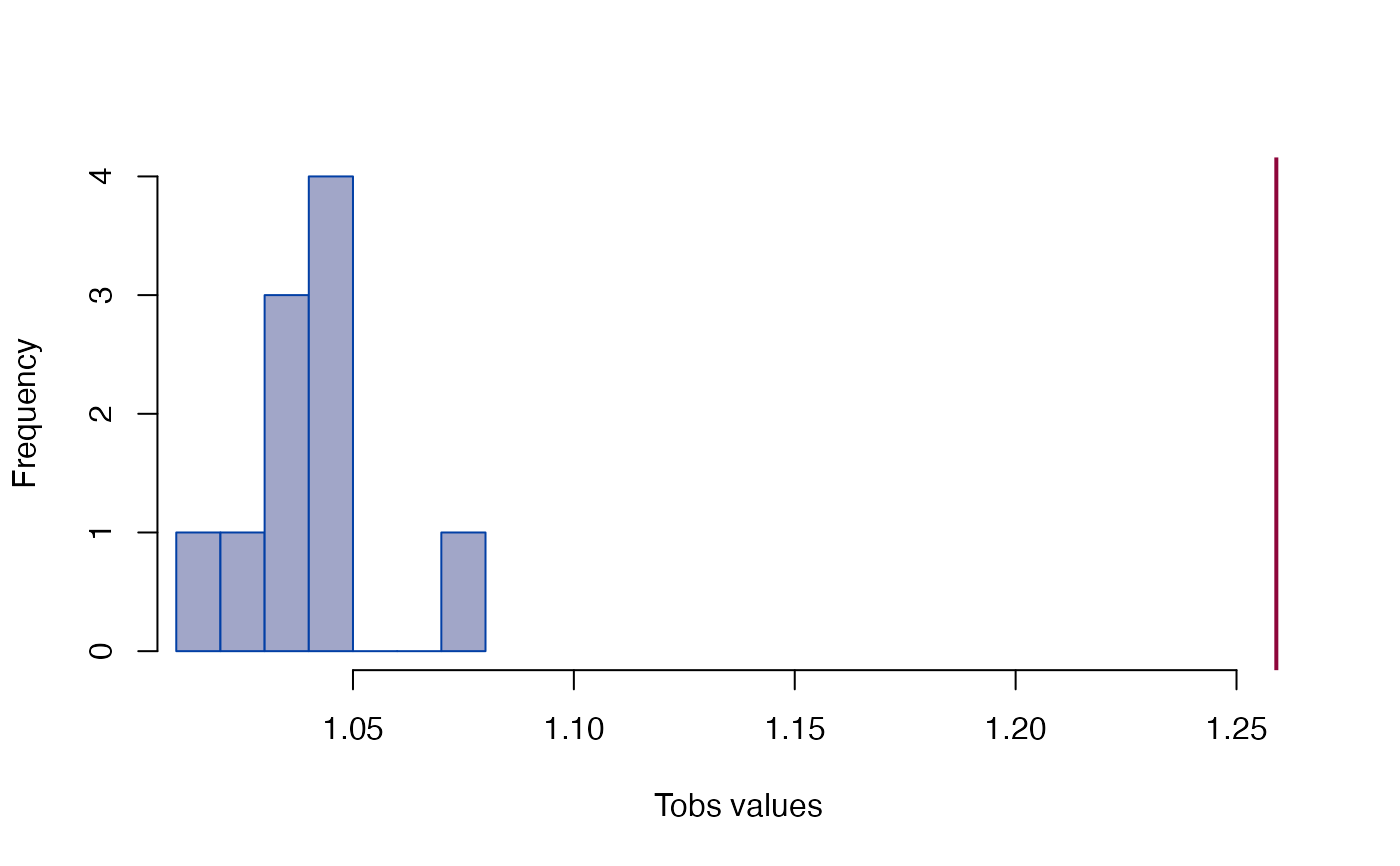
#> Tobs = 1.259, p < 2.22e-16
global_test(gm)
#>
#> Bootstrap based EDMA G-test
#>
#> data: growth matrix
#> G -value = 1.259, B = 10, p-value < 2.2e-16
#>
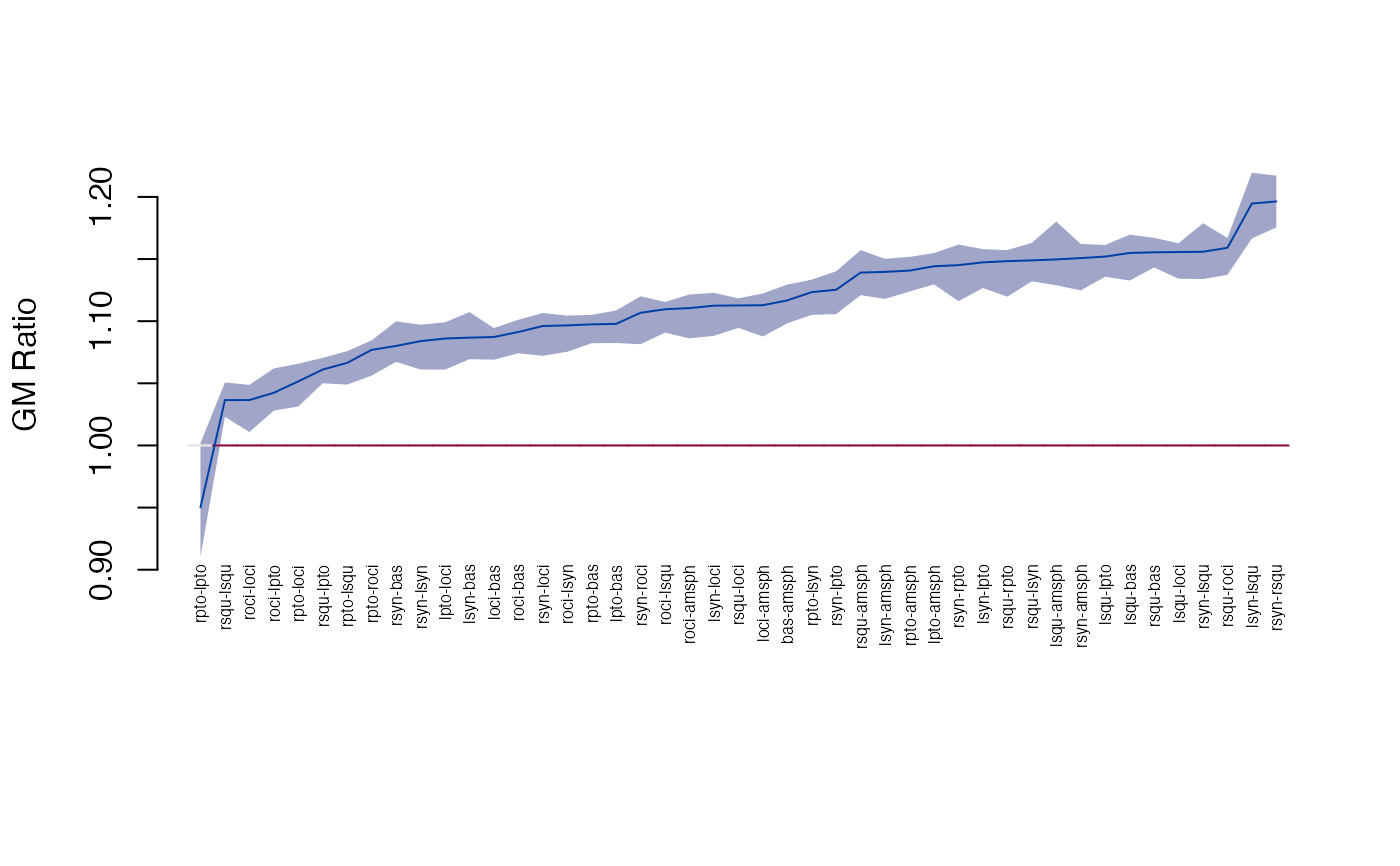
head(confint(gm))
#> 2.5% 97.5%
#> bas-amsph 1.098286 1.129447
#> loci-amsph 1.087711 1.122313
#> lpto-amsph 1.129613 1.154855
#> lsqu-amsph 1.128924 1.180152
#> lsyn-amsph 1.117893 1.150160
#> roci-amsph 1.086130 1.121514
head(get_gm(gm))
#> row col dist lower upper
#> 1 bas amsph 1.116726 1.098286 1.129447
#> 2 loci amsph 1.112833 1.087711 1.122313
#> 3 lpto amsph 1.144189 1.129613 1.154855
#> 4 lsqu amsph 1.149705 1.128924 1.180152
#> 5 lsyn amsph 1.139680 1.117893 1.150160
#> 6 roci amsph 1.110515 1.086130 1.121514
head(get_gm(gm, sort=TRUE, decreasing=TRUE))
#> row col dist lower upper
#> 45 rsyn rsqu 1.196344 1.175489 1.217173
#> 31 lsyn lsqu 1.194661 1.166476 1.219401
#> 41 rsqu roci 1.159037 1.137300 1.166941
#> 35 rsyn lsqu 1.155865 1.133920 1.178853
#> 19 lsqu loci 1.155629 1.134197 1.162690
#> 16 rsqu bas 1.155440 1.143204 1.167108
head(get_gm(gm, sort=TRUE, decreasing=FALSE))
#> row col dist lower upper
#> 28 rpto lpto 0.9502249 0.9103352 1.001992
#> 34 rsqu lsqu 1.0364970 1.0230670 1.050673
#> 21 roci loci 1.0365211 1.0108008 1.048766
#> 27 roci lpto 1.0423805 1.0279959 1.061963
#> 22 rpto loci 1.0515532 1.0313671 1.065774
#> 29 rsqu lpto 1.0610708 1.0500582 1.070469
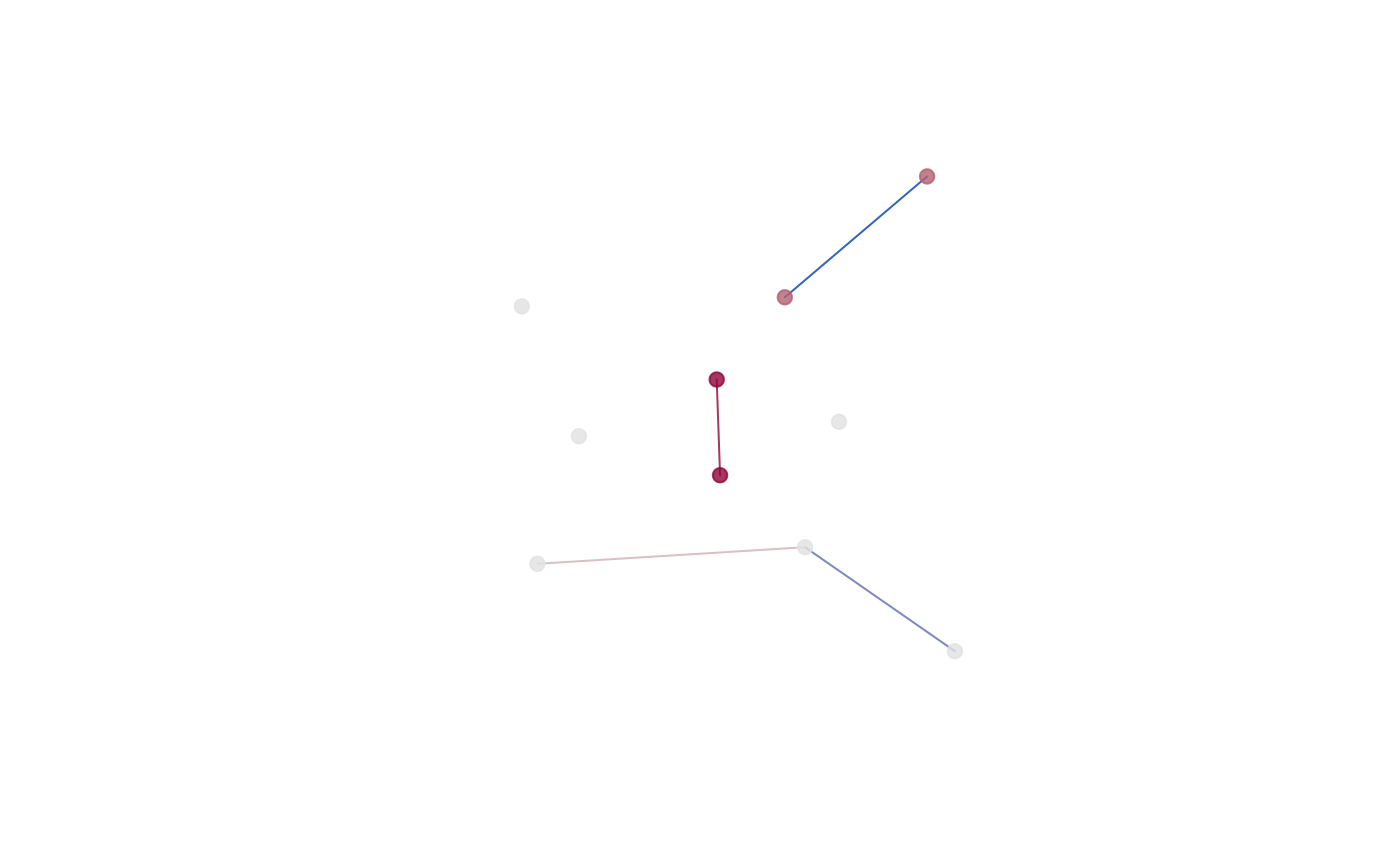
plot_ord(gm)
 plot_clust(gm)
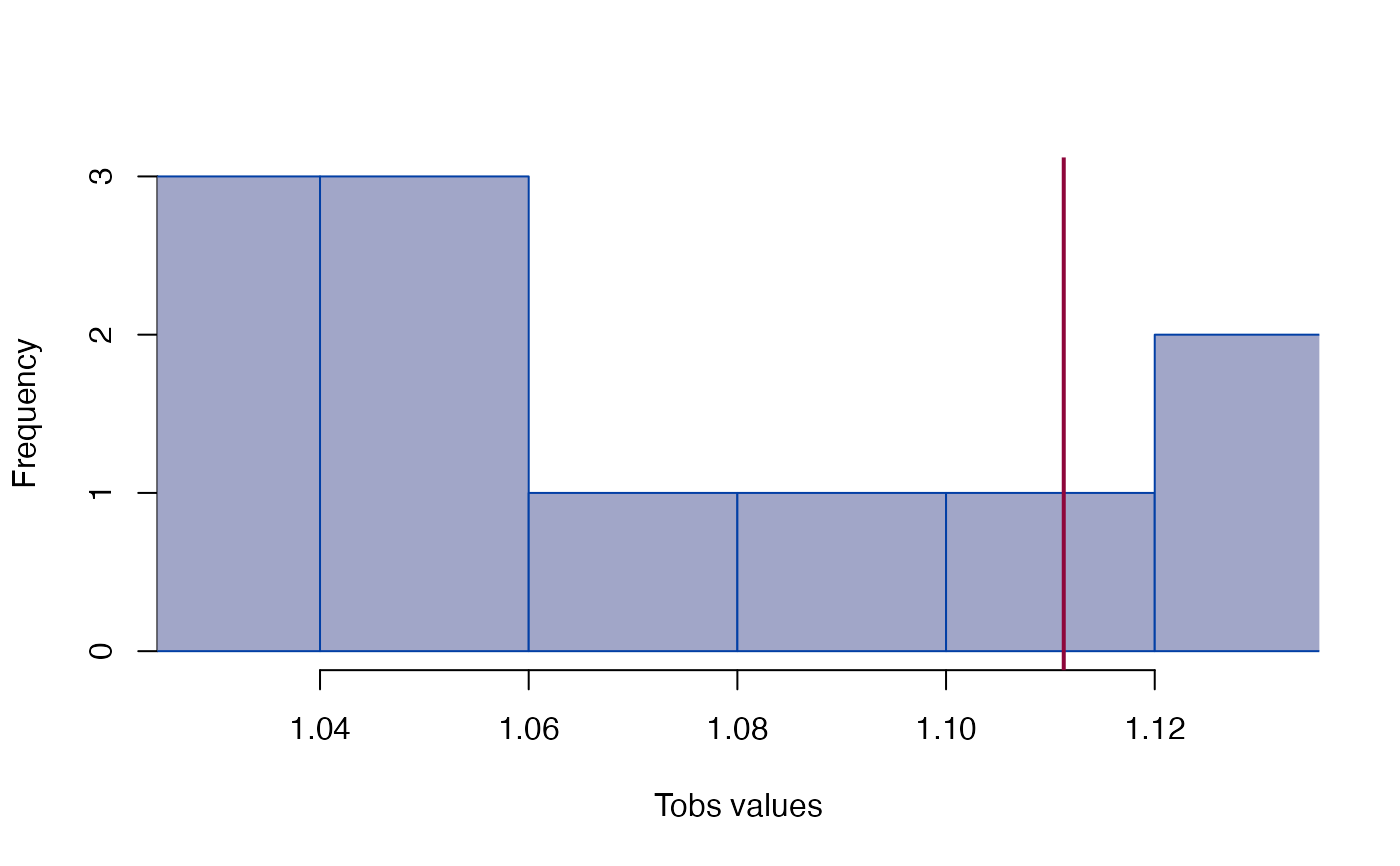
 plot_test(gm)
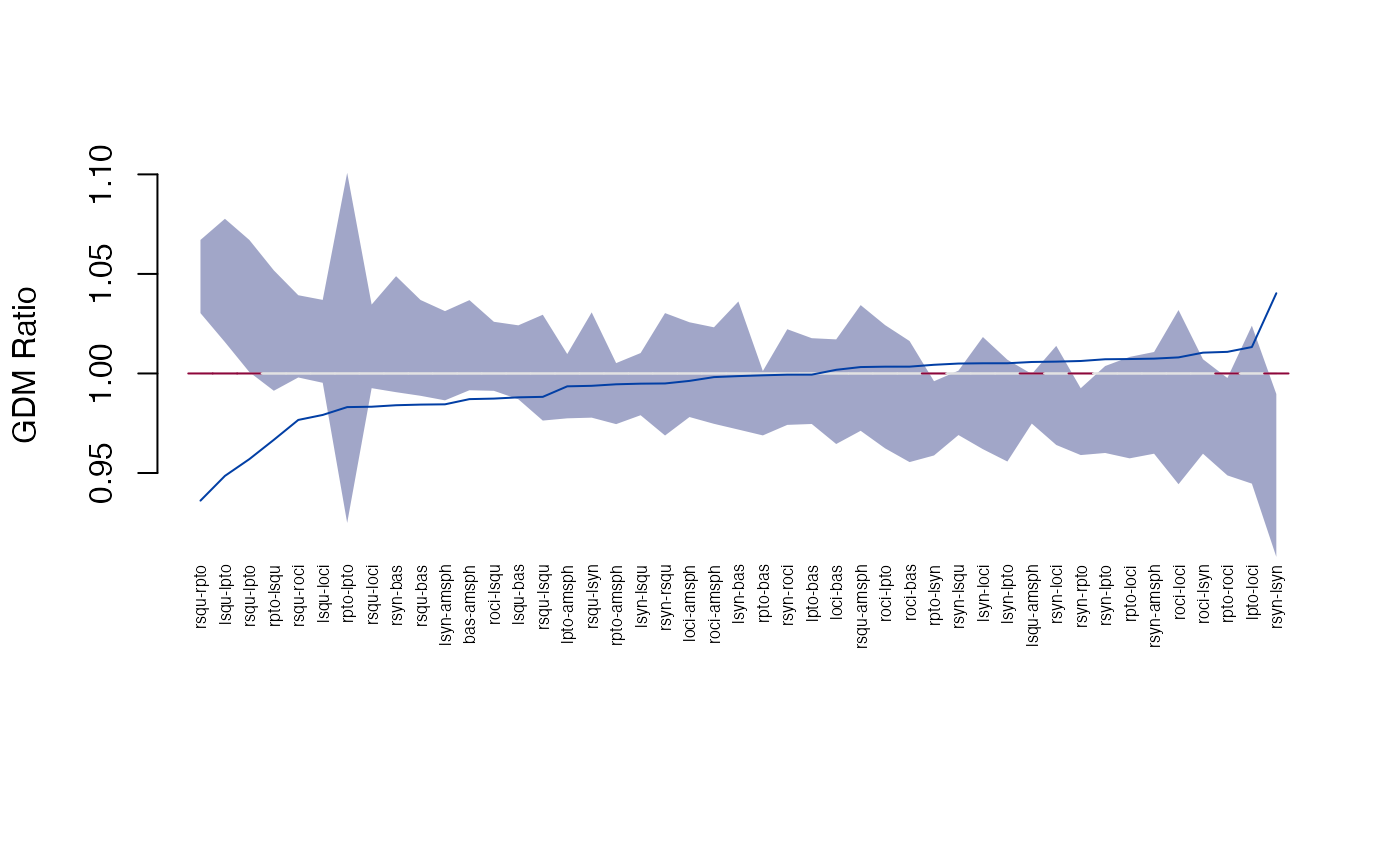
 plot_ci(gm)
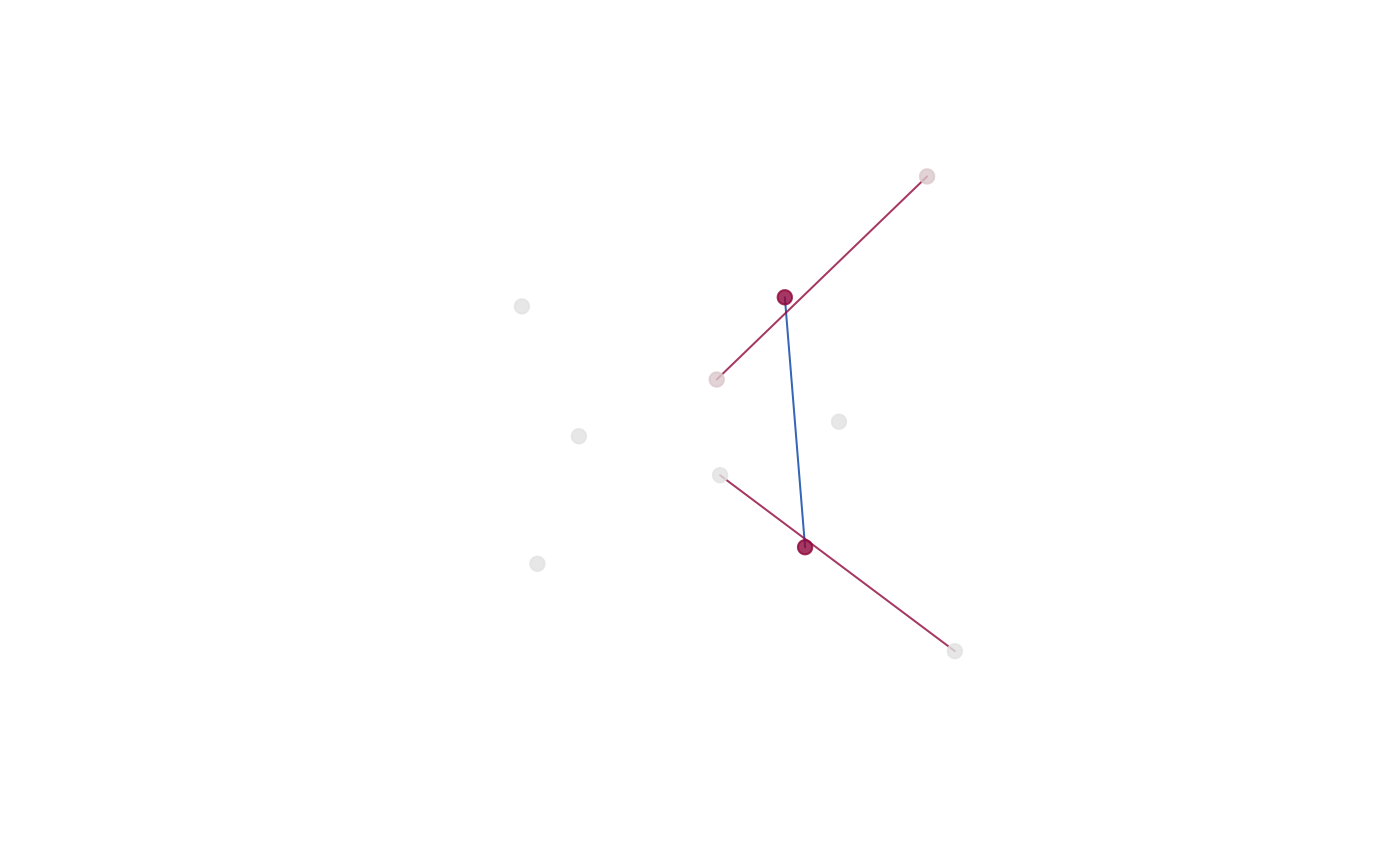
 plot_2d(gm)
 if (interactive())
plot_3d(gm)
## --- growth difference matrix ---
file_b1 <- system.file("extdata/growth/CZEM_mut_global.xyz",
package="EDMAinR")
file_b2 <- system.file("extdata/growth/CZP0_mut_global.xyz",
package="EDMAinR")
b1 <- read_xyz(file_b1)[l,,]
b2 <- read_xyz(file_b2)[l,,]
b1
#> EDMA data: Crouzon mutant embryonic mouse
#> 10 landmarks, 3 dimensions, 18 specimens
b2
#> EDMA data: Crouzon mutant newborn mouse
#> 10 landmarks, 3 dimensions, 11 specimens
fit_b1 <- edma_fit(b1, B=10)
fit_b2 <- edma_fit(b2, B=10)
gdm <- edma_gdm(a1=fit_a1, a2=fit_a2, b1=fit_b1, b2=fit_b2, B=10)
gdm
#> EDMA growth difference matrix
#> Call: edma_gdm(a1 = fit_a1, a2 = fit_a2, b1 = fit_b1, b2 = fit_b2,
#> B = 10)
#> 10 bootstrap runs (ref: denominator)
#> Tobs = 1.1113, p = 0.27273
global_test(gdm)
#>
#> Bootstrap based EDMA G-test
#>
#> data: growth difference matrix
#> G -value = 1.1113, B = 11, p-value = 0.2727
#>
head(confint(gdm))
#> 2.5% 97.5%
#> bas-amsph 0.9915716 1.0368321
#> loci-amsph 0.9781170 1.0257089
#> lpto-amsph 0.9774645 1.0097597
#> lsqu-amsph 0.9748169 0.9997238
#> lsyn-amsph 0.9864931 1.0313089
#> roci-amsph 0.9747043 1.0231884
head(get_gdm(gdm))
#> row col dist lower upper
#> 1 bas amsph 0.9871097 0.9915716 1.0368321
#> 2 loci amsph 0.9962675 0.9781170 1.0257089
#> 3 lpto amsph 0.9935320 0.9774645 1.0097597
#> 4 lsqu amsph 1.0057657 0.9748169 0.9997238
#> 5 lsyn amsph 0.9844980 0.9864931 1.0313089
#> 6 roci amsph 0.9981683 0.9747043 1.0231884
head(get_gdm(gdm, sort=TRUE, decreasing=TRUE))
#> row col dist lower upper
#> 39 rsyn lsyn 1.040292 0.9078684 0.9896739
#> 18 lpto loci 1.013272 0.9446575 1.0240004
#> 40 rpto roci 1.010858 0.9487873 0.9977089
#> 36 roci lsyn 1.010448 0.9596945 1.0071426
#> 21 roci loci 1.008071 0.9443650 1.0318483
#> 9 rsyn amsph 1.007449 0.9596942 1.0107837
head(get_gdm(gdm, sort=TRUE, decreasing=FALSE))
#> row col dist lower upper
#> 43 rsqu rpto 0.9361207 1.0303048 1.067071
#> 25 lsqu lpto 0.9485414 1.0157609 1.077698
#> 29 rsqu lpto 0.9569724 1.0006861 1.067052
#> 33 rpto lsqu 0.9666629 0.9913131 1.051787
#> 41 rsqu roci 0.9766552 0.9979848 1.039299
#> 19 lsqu loci 0.9791661 0.9953173 1.036952
plot_ord(gdm)
if (interactive())
plot_3d(gm)
## --- growth difference matrix ---
file_b1 <- system.file("extdata/growth/CZEM_mut_global.xyz",
package="EDMAinR")
file_b2 <- system.file("extdata/growth/CZP0_mut_global.xyz",
package="EDMAinR")
b1 <- read_xyz(file_b1)[l,,]
b2 <- read_xyz(file_b2)[l,,]
b1
#> EDMA data: Crouzon mutant embryonic mouse
#> 10 landmarks, 3 dimensions, 18 specimens
b2
#> EDMA data: Crouzon mutant newborn mouse
#> 10 landmarks, 3 dimensions, 11 specimens
fit_b1 <- edma_fit(b1, B=10)
fit_b2 <- edma_fit(b2, B=10)
gdm <- edma_gdm(a1=fit_a1, a2=fit_a2, b1=fit_b1, b2=fit_b2, B=10)
gdm
#> EDMA growth difference matrix
#> Call: edma_gdm(a1 = fit_a1, a2 = fit_a2, b1 = fit_b1, b2 = fit_b2,
#> B = 10)
#> 10 bootstrap runs (ref: denominator)
#> Tobs = 1.1113, p = 0.27273
global_test(gdm)
#>
#> Bootstrap based EDMA G-test
#>
#> data: growth difference matrix
#> G -value = 1.1113, B = 11, p-value = 0.2727
#>
head(confint(gdm))
#> 2.5% 97.5%
#> bas-amsph 0.9915716 1.0368321
#> loci-amsph 0.9781170 1.0257089
#> lpto-amsph 0.9774645 1.0097597
#> lsqu-amsph 0.9748169 0.9997238
#> lsyn-amsph 0.9864931 1.0313089
#> roci-amsph 0.9747043 1.0231884
head(get_gdm(gdm))
#> row col dist lower upper
#> 1 bas amsph 0.9871097 0.9915716 1.0368321
#> 2 loci amsph 0.9962675 0.9781170 1.0257089
#> 3 lpto amsph 0.9935320 0.9774645 1.0097597
#> 4 lsqu amsph 1.0057657 0.9748169 0.9997238
#> 5 lsyn amsph 0.9844980 0.9864931 1.0313089
#> 6 roci amsph 0.9981683 0.9747043 1.0231884
head(get_gdm(gdm, sort=TRUE, decreasing=TRUE))
#> row col dist lower upper
#> 39 rsyn lsyn 1.040292 0.9078684 0.9896739
#> 18 lpto loci 1.013272 0.9446575 1.0240004
#> 40 rpto roci 1.010858 0.9487873 0.9977089
#> 36 roci lsyn 1.010448 0.9596945 1.0071426
#> 21 roci loci 1.008071 0.9443650 1.0318483
#> 9 rsyn amsph 1.007449 0.9596942 1.0107837
head(get_gdm(gdm, sort=TRUE, decreasing=FALSE))
#> row col dist lower upper
#> 43 rsqu rpto 0.9361207 1.0303048 1.067071
#> 25 lsqu lpto 0.9485414 1.0157609 1.077698
#> 29 rsqu lpto 0.9569724 1.0006861 1.067052
#> 33 rpto lsqu 0.9666629 0.9913131 1.051787
#> 41 rsqu roci 0.9766552 0.9979848 1.039299
#> 19 lsqu loci 0.9791661 0.9953173 1.036952
plot_ord(gdm)
 plot_clust(gdm)
 plot_test(gdm)
 plot_ci(gdm)
 plot_2d(gdm) # need real data
 if (interactive())
plot_3d(gdm)
if (interactive())
plot_3d(gdm)