Alternative plot and identify Functions for Ordination
ordiplot.RdFunction ordiplot is an alternative plotting function which
can be worked with any vegan ordination result and many
non-vegan results. In addition, plot functions for
vegan ordinations return invisibly an "ordiplot" result
object, and this allows using ordiplot support functions with
this result: identify can be used to add labels to selected
site, species or constraint points, and points and
text can add elements to the plot.
ordiplot(ord, choices = c(1, 2), type="points", display, xlim, ylim,
     cex = 0.7, ...)
# S3 method for ordiplot
identify(x, what, labels,  ...)
# S3 method for ordiplot
points(x, what, select, arrows = FALSE, ...)
# S3 method for ordiplot
text(x, what, labels, select, arrows = FALSE, ...)
Arguments
| ord | A result from an ordination. |
|---|---|
| choices | Axes shown. |
| type | The type of graph which may be |
| display | Display only "sites" or "species". The default for most
methods is to display both, but for |
| xlim, ylim | the x and y limits (min,max) of the plot. |
| cex | Character expansion factor for points and text. |
| ... | Other graphical parameters. |
| x | A result object from |
| what | Items identified in the ordination plot. The types depend
on the kind of plot used. Most methods know |
| labels | Optional text used for labels. Row names will be used if this is missing. |
| arrows | Draw arrows from the origin. This will always be
|
| select | Items to be displayed. This can either be a logical
vector which is |
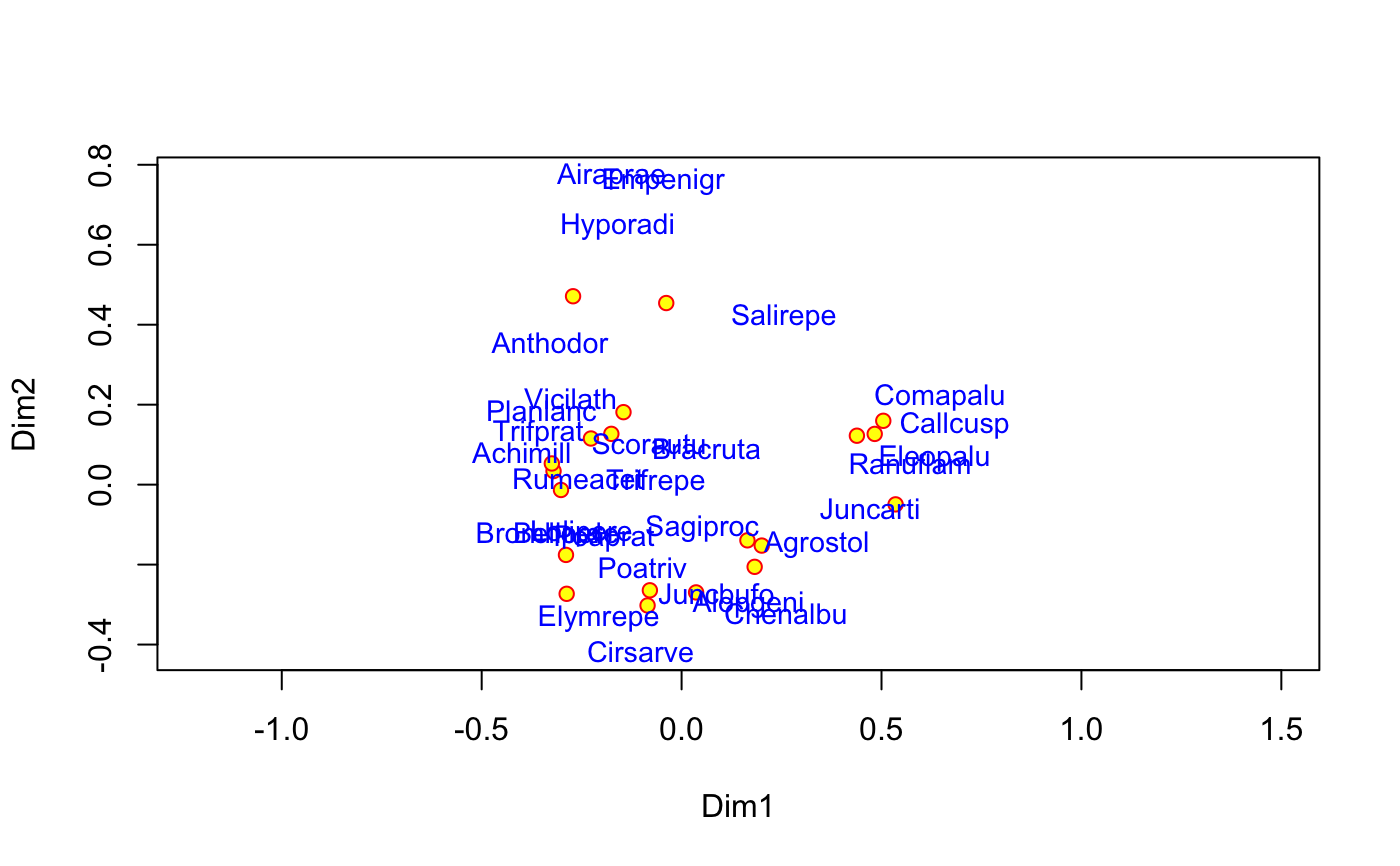
Details
Function ordiplot draws an ordination diagram using black circles for
sites and red crosses for species. It returns invisibly an object of
class ordiplot which can be used by identify.ordiplot
to label selected sites or species, or constraints in
cca and rda.
The function can handle output from several alternative ordination
methods. For cca, rda and
decorana it uses their plot method with option
type = "points". In addition, the plot functions of
these methods return invisibly an ordiplot object which can
be used by identify.ordiplot to label points. For other
ordinations it relies on scores to extract the scores.
For full user control of plots, it is best to call ordiplot
with type = "none" and save the result, and then add sites and
species using points.ordiplot or text.ordiplot which
both pass all their arguments to the corresponding default graphical
functions.
Value
Function ordiplot returns invisibly an object of class
ordiplot with used scores. In general, vegan plot
functions for ordination results will also return an invisible
ordiplot object. If the plot(..., type = "n") was used
originally, the plot is empty, and items can be added with the
invisible object. Functions points and text will return
their input object without modification, which allows chaining these
commands, for instance with magrittr pipes. Function
identify.ordiplot uses this object to label the point.
Note
The purpose of these functions is to provide similar functionality as
the plot, plotid and specid methods in library
labdsv. The functions are somewhat limited in parametrization,
but you can call directly the standard identify and
plot functions for a better user control.
See also
identify for basic operations, plot.cca,
plot.decorana, plot.procrustes which also
produce objects for
identify.ordiplot and scores for extracting
scores from non-vegan ordinations.
Examples
# Draw a plot for a non-vegan ordination (cmdscale). data(dune) dune.dis <- vegdist(wisconsin(dune)) dune.mds <- cmdscale(dune.dis, eig = TRUE) dune.mds$species <- wascores(dune.mds$points, dune, expand = TRUE) pl <- ordiplot(dune.mds, type = "none")# Default plot of the previous using identify to label selected points if (FALSE) { pl <- ordiplot(dune.mds) identify(pl, "spec")}