Display Groups or Factor Levels in Ordination Diagrams
ordihull.RdFunctions to add convex hulls, “spider” graphs, ellipses
or cluster dendrogram to ordination diagrams. The ordination
diagrams can be produced by vegan plot.cca,
plot.decorana or ordiplot.
ordihull(ord, groups, display = "sites", draw = c("lines","polygon", "none"),
         col = NULL, alpha = 127, show.groups, label = FALSE,
         border = NULL, lty = NULL, lwd = NULL, ...)
ordiellipse(ord, groups, display="sites", kind = c("sd","se", "ehull"),
         conf, draw = c("lines","polygon", "none"),
         w = weights(ord, display), col = NULL, alpha = 127, show.groups,
         label = FALSE, border = NULL, lty = NULL, lwd=NULL, ...)
ordibar(ord, groups, display = "sites", kind = c("sd", "se"), conf,
         w = weights(ord, display), col = 1, show.groups, label = FALSE,
         lwd = NULL, length = 0,  ...)
ordispider(ord, groups, display="sites", w = weights(ord, display),
         spiders = c("centroid", "median"),  show.groups,
         label = FALSE, col = NULL, lty = NULL, lwd = NULL, ...)
ordicluster(ord, cluster, prune = 0, display = "sites",
            w = weights(ord, display), col = 1, draw = c("segments", "none"),
            ...)
# S3 method for ordihull
summary(object, ...)
# S3 method for ordiellipse
summary(object, ...)
ordiareatest(ord, groups, area = c("hull", "ellipse"), kind = "sd",
         permutations = 999, parallel = getOption("mc.cores"), ...)
Arguments
| ord | An ordination object or an |
|---|---|
| groups | Factor giving the groups for which the graphical item is drawn. |
| display | Item to displayed. |
| draw | character; how should objects be represented on the plot?
For |
| col | Colour of hull or ellipse lines (if |
| alpha | Transparency of the fill |
| show.groups | Show only given groups. This can be a vector, or
|
| label | Label the |
| w | Weights used to find the average within group. Weights are
used automatically for |
| kind | Draw standard deviations of points ( |
| conf | Confidence limit for ellipses, e.g. 0.95. If given, the
corresponding |
| spiders | Are centres or spider bodies calculated either as centroids (averages) or spatial medians. |
| cluster | Result of hierarchic cluster analysis, such as
|
| prune | Number of upper level hierarchies removed from the
dendrogram. If |
| object | A result object from |
| area | Evaluate the area of convex hulls of |
| permutations | a list of control values for the permutations
as returned by the function |
| parallel | Number of parallel processes or a predefined socket
cluster. With |
| lty, lwd, border | Vectors of these parameters can be supplied
and will be applied (if appropriate) for each element of
|
| length | Width (in inches) of the small (“caps”) at the
ends of the bar segment (passed to |
| ... | Parameters passed to graphical functions or to
|
Details
Function ordihull draws lines or
polygons for the convex
hulls found by function chull encircling
the items in the groups.
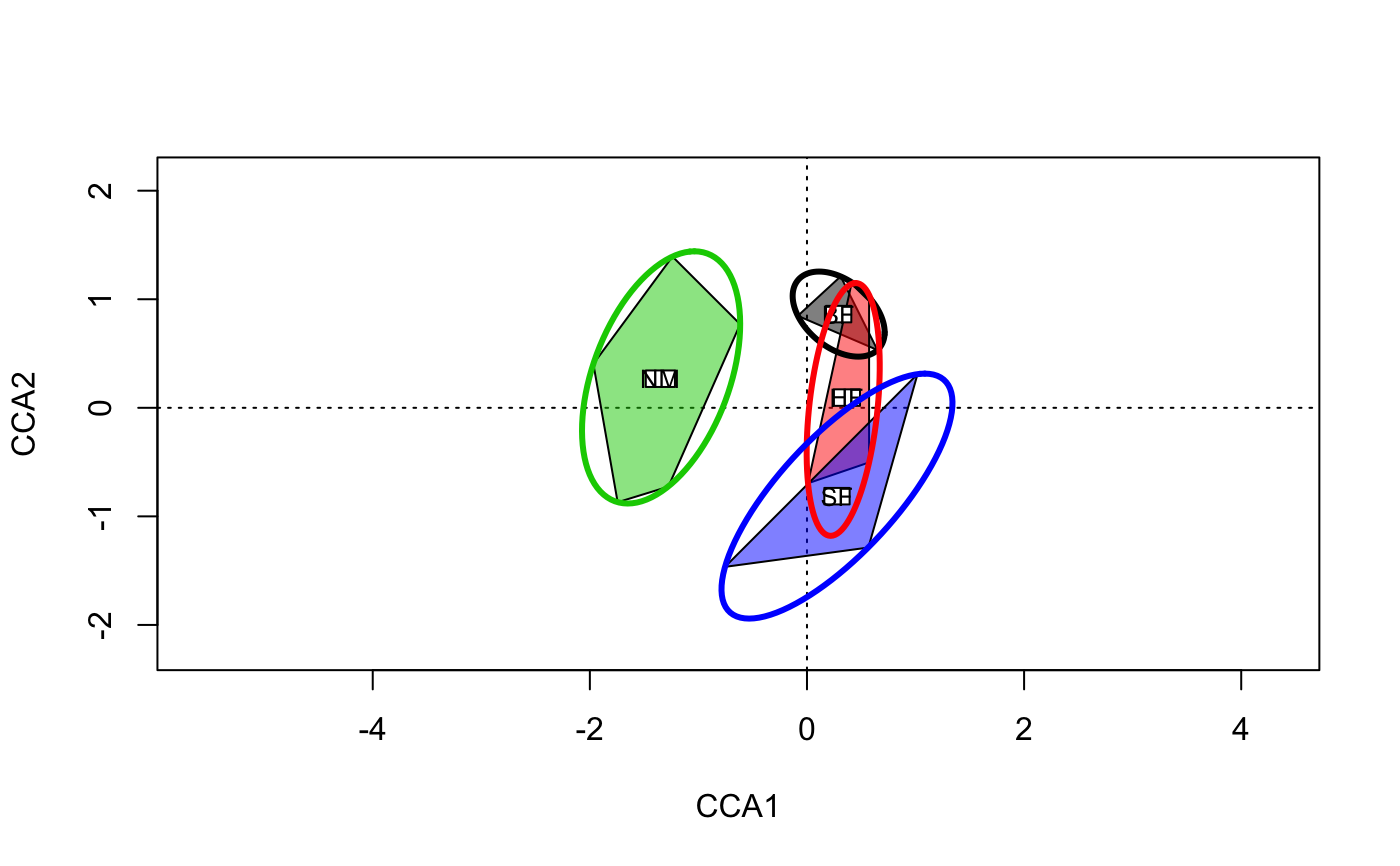
Function ordiellipse draws lines or
polygons for ellipses by groups. The function
can either draw standard deviation of points (kind="sd") or
standard error of the (weighted) centroids (kind="se"), and
the (weighted) correlation defines the direction of the principal
axis of the ellipse. When kind = "se" is used together with
argument conf, the ellipses will show the confidence regions
for the locations of group centroids. With kind="ehull" the
function draws an ellipse that encloses all points of a group using
ellipsoidhull (cluster package).
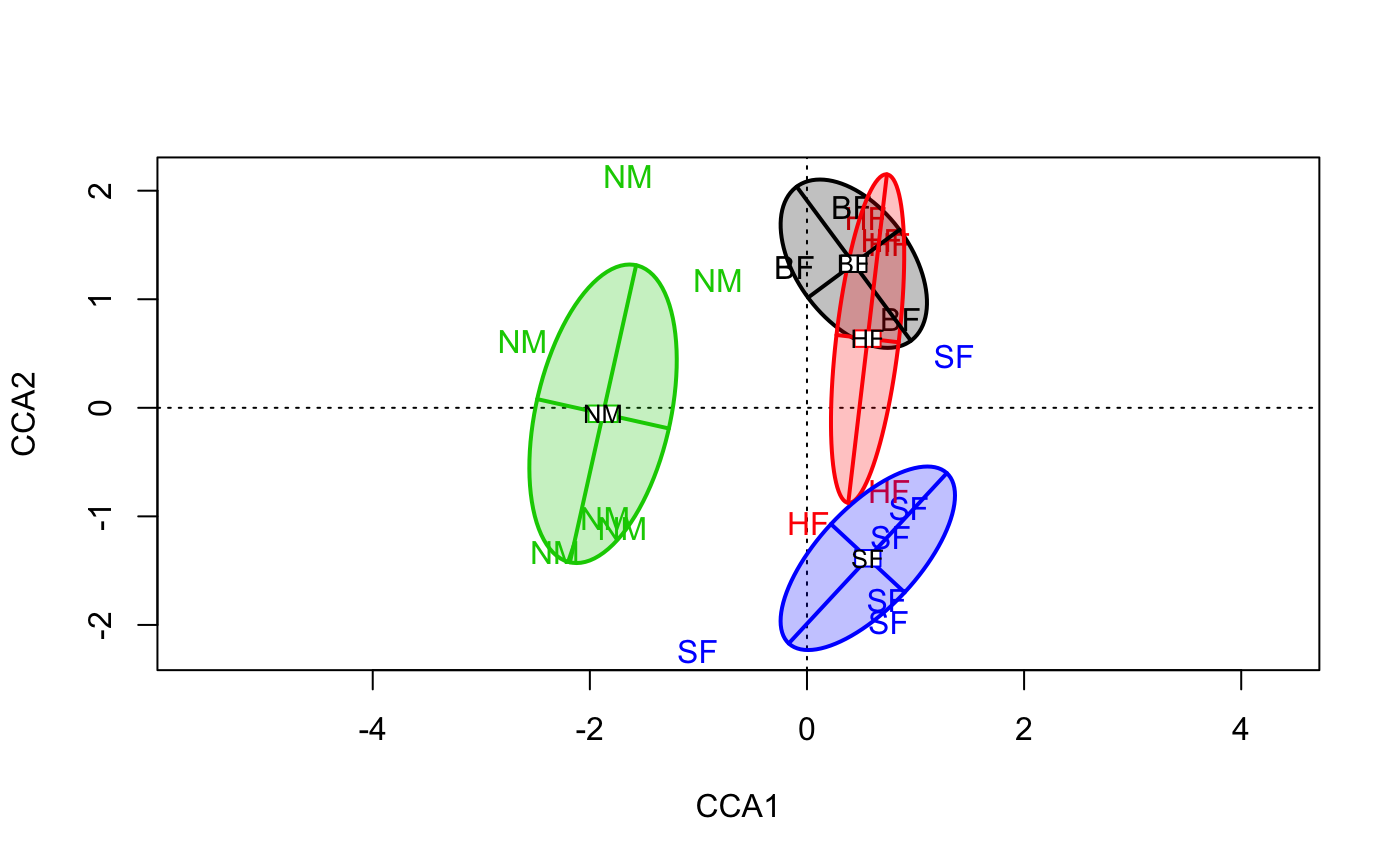
Function ordibar draws crossed “error bars” using
either either standard deviation of point scores or standard error
of the (weighted) average of scores. These are the principal axes of
the corresponding ordiellipse, and are found by principal
component analysis of the (weighted) covariance matrix.
Functions ordihull and ordiellipse return invisibly an
object that has a summary method that returns the coordinates
of centroids and areas of the hulls or ellipses. Function
ordiareatest studies the one-sided hypothesis that these
areas are smaller than with randomized groups. Argument
kind can be used to select the kind of ellipse, and has no
effect with convex hulls.
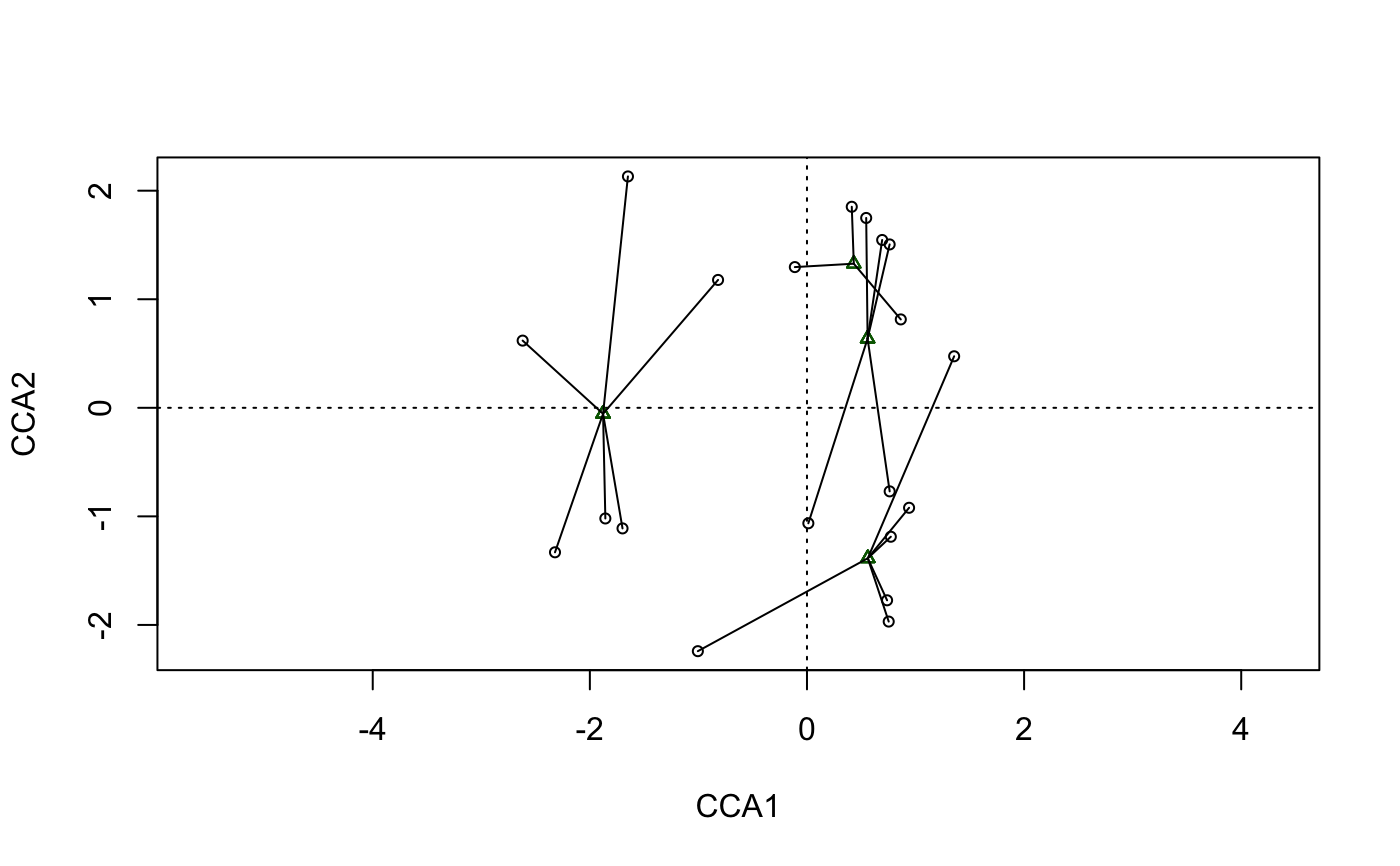
Function ordispider draws a ‘spider’ diagram where
each point is connected to the group centroid with
segments. Weighted centroids are used in the
correspondence analysis methods cca and
decorana or if the user gives the weights in the
call. If ordispider is called with cca or
rda result without groups argument, the
function connects each ‘WA’ scores to the corresponding
‘LC’ score. If the argument is a (invisible)
ordihull object, the function will connect the points of the
hull to their centroid.
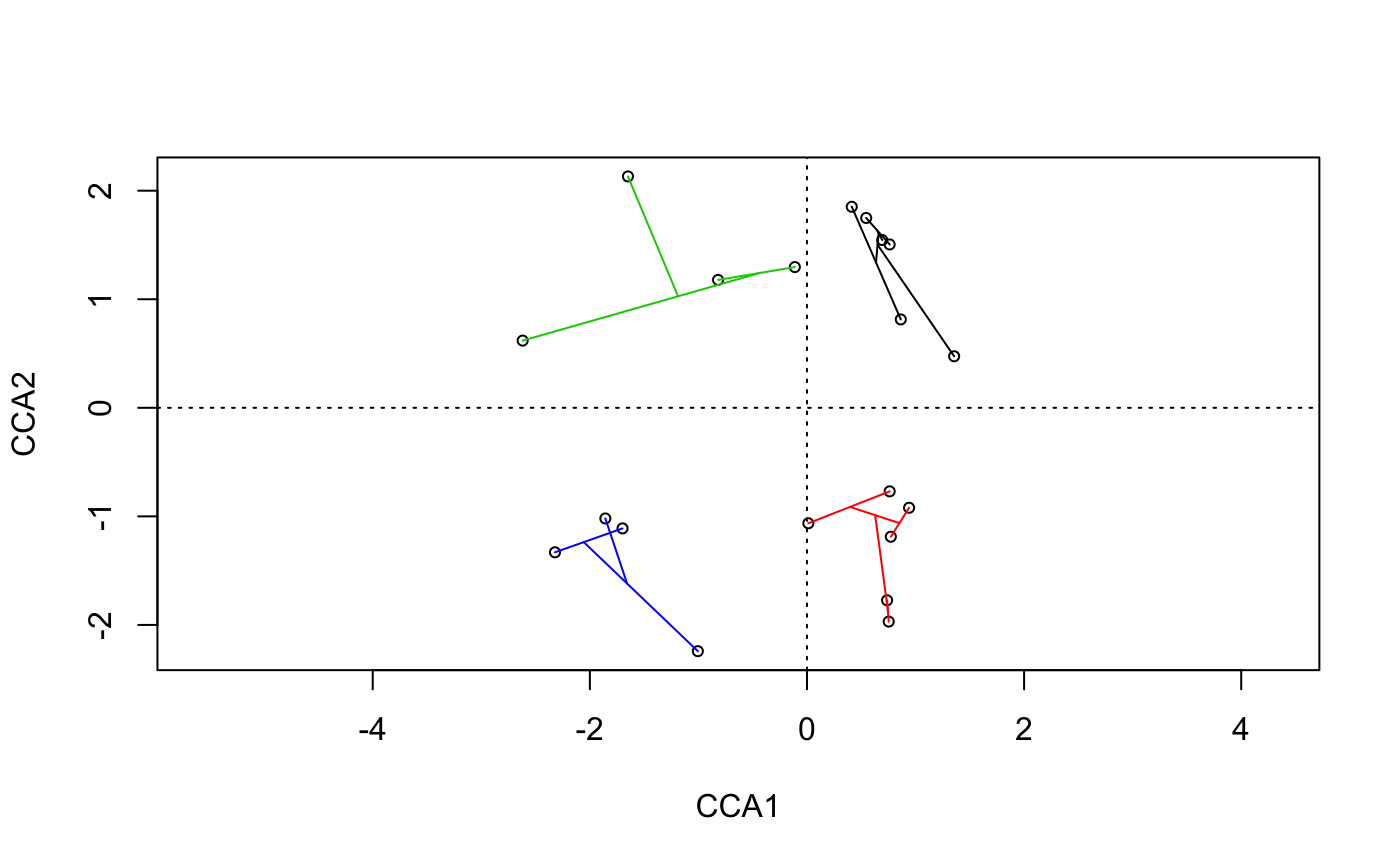
Function ordicluster overlays a cluster dendrogram onto
ordination. It needs the result from a hierarchic clustering such as
hclust or agnes, or other with
a similar structure. Function ordicluster connects cluster
centroids to each other with line segments. Function
uses centroids of all points in the clusters, and is therefore
similar to average linkage methods.
Note
These functions add graphical items to ordination graph: You
must draw a graph first. To draw line segments, grids or arrows, see
ordisegments, ordigrid
andordiarrows.
Value
Functions ordihull, ordiellipse and ordispider
return the invisible plotting structure.
Function ordispider return the coordinates to which each
point is connected (centroids or ‘LC’ scores).
Function ordihull and ordiellipse return invisibly an
object that has a summary method that returns the coordinates
of centroids and areas of the hulls or ellipses. Function
ordiareatest studies the one-sided hypothesis that these
areas are smaller than with randomized groups.
See also
The functions pass parameters to basic graphical functions,
and you may wish to change the default values in
lines, segments and
polygon. You can pass parameters to
scores as well. Underlying functions for
ordihull is chull. The underlying function for
ellipsoid hulls in ordiellipse is
ellipsoidhull.
Examples
data(dune) data(dune.env) mod <- cca(dune ~ Management, dune.env) plot(mod, type="n", scaling = "symmetric")## Catch the invisible result of ordihull... pl <- with(dune.env, ordihull(mod, Management, scaling = "symmetric", label = TRUE))#> BF HF NM SF #> CCA1 0.2917476 0.36826105 -1.3505642 0.2762936 #> CCA2 0.8632208 0.09419919 0.2681515 -0.8139398 #> Area 0.1951715 0.59943363 1.7398193 1.0144372pl <- with(dune.env, ordihull(mod, Management, scaling = "symmetric", col = 1:4, draw="polygon", label =TRUE))with(dune.env, ordiellipse(mod, Management, scaling = "symmetric", kind = "ehull", col = 1:4, lwd=3))ordispider(mod)with(dune.env, text(mod, display="sites", labels = as.character(Management), col=as.numeric(Management)))pl <- with(dune.env, ordiellipse(mod, Management, kind="se", conf=0.95, lwd=2, draw = "polygon", col=1:4, border=1:4, alpha=63))summary(pl)#> BF HF NM SF #> CCA1 0.4312652 0.5583211 -1.87848340 0.5601499 #> CCA2 1.3273917 0.6373120 -0.05503211 -1.3859924 #> Area 1.4559842 1.3806668 2.73667419 1.5559135## add confidence bars with(dune.env, ordibar(mod, Management, kind="se", conf=0.95, lwd=2, col=1:4, label=TRUE))