What can we do with a single survey?
August 04, 2015 Talks poster single visit detect R
We presented a poster at the ICCB/ECCB 2015 congress in Montpellier, France, that summarized our research on single visit methodology.
We showed that if information on habitat covariates that affect occupancy/abundance and detection are collected, then one can estimate detection probability as well as occupancy/abundance parameters.
Check out the reprints and the poster made with Scribus:
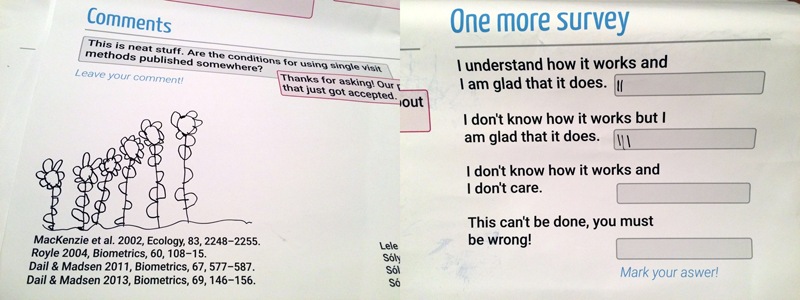
Organizers wanted the poster sessions to be interactive. But posters are hung up much longer than the actual poster session. What can be done to make posters interactive in the absence of a presenter? This gave the idea to mimic a blog post, both in style and in structure. I added space for comments and created a mini poll, left out a marker on a string, and waited for the results.
Survey responses were mostly positive, which is good. But the best of all was a cute little girl who was thrilled at the notion of drawing onto the poster. Thanks for the feedback!
Closing the gap between data and decision making
Analyzing Ecological Data with Detection Error
This course is for researchers who analyze field observations. These data are often inconsistent because sampling protocols can change across projects, over time, or when older data are combined with new recordings.
- Analyzing Ecological Data with Detection Error
- Fitting removal models with the detect R package
- Shiny slider examples with the intrval R package
- Phylogeny and species traits predict bird detectability
- PVA: Publication Viability Analysis, round 3
ABMI (7) ARU (1) Alberta (1) BAM (1) C (1) CRAN (1) Hungary (2) JOSM (2) MCMC (2) PVA (2) PVAClone (1) QPAD (3) R (21) R packages (1) abundance (1) bioacoustics (1) biodiversity (1) birds (2) course (2) data (1) data cloning (4) datacloning (1) dclone (3) density (1) dependencies (1) detect (3) detectability (4) footprint (3) forecasting (1) functions (3) intrval (4) lhreg (1) mefa4 (1) monitoring (2) pbapply (5) phylogeny (1) plyr (1) poster (2) processing time (2) progress bar (4) publications (2) report (1) sector effects (1) shiny (1) single visit (1) site (1) slider (1) slides (2) special (3) species (1) trend (1) tutorials (2) video (4) workshop (2)