Bibliometrics
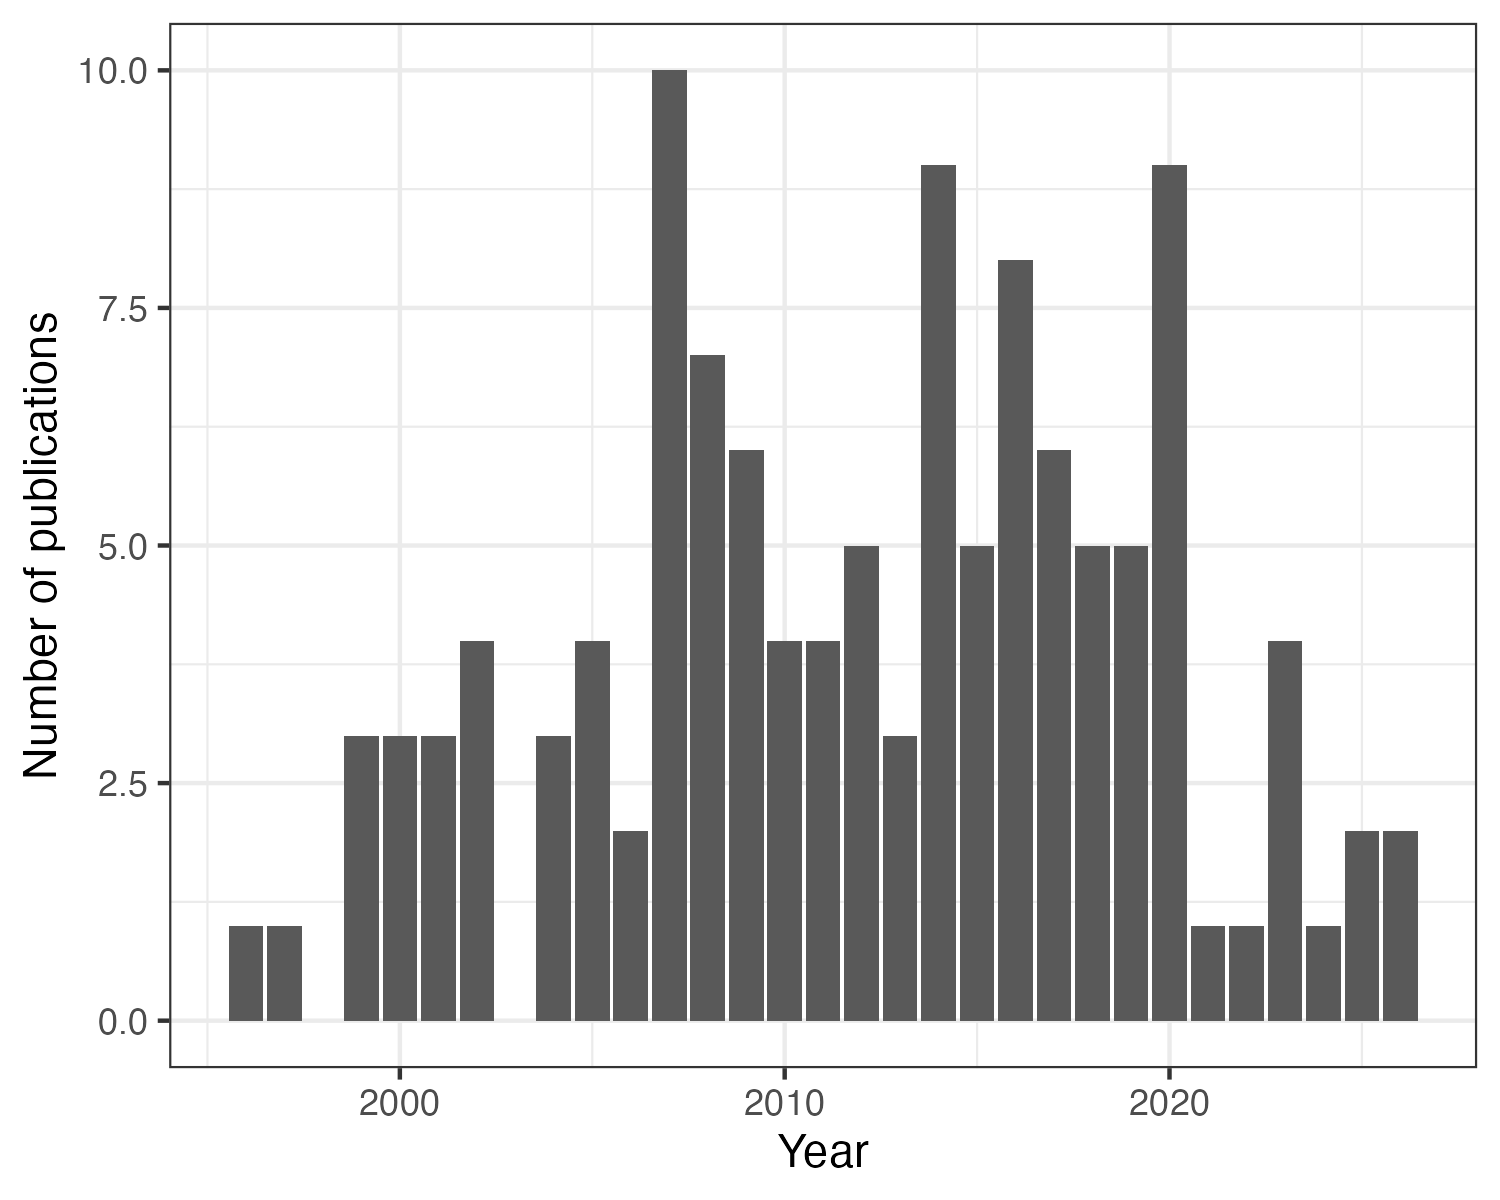
Below are plots of the number of publications and citations over time, based on data from Google Scholar, cleaned up to show only papers, without software related entries.
Publications over time:
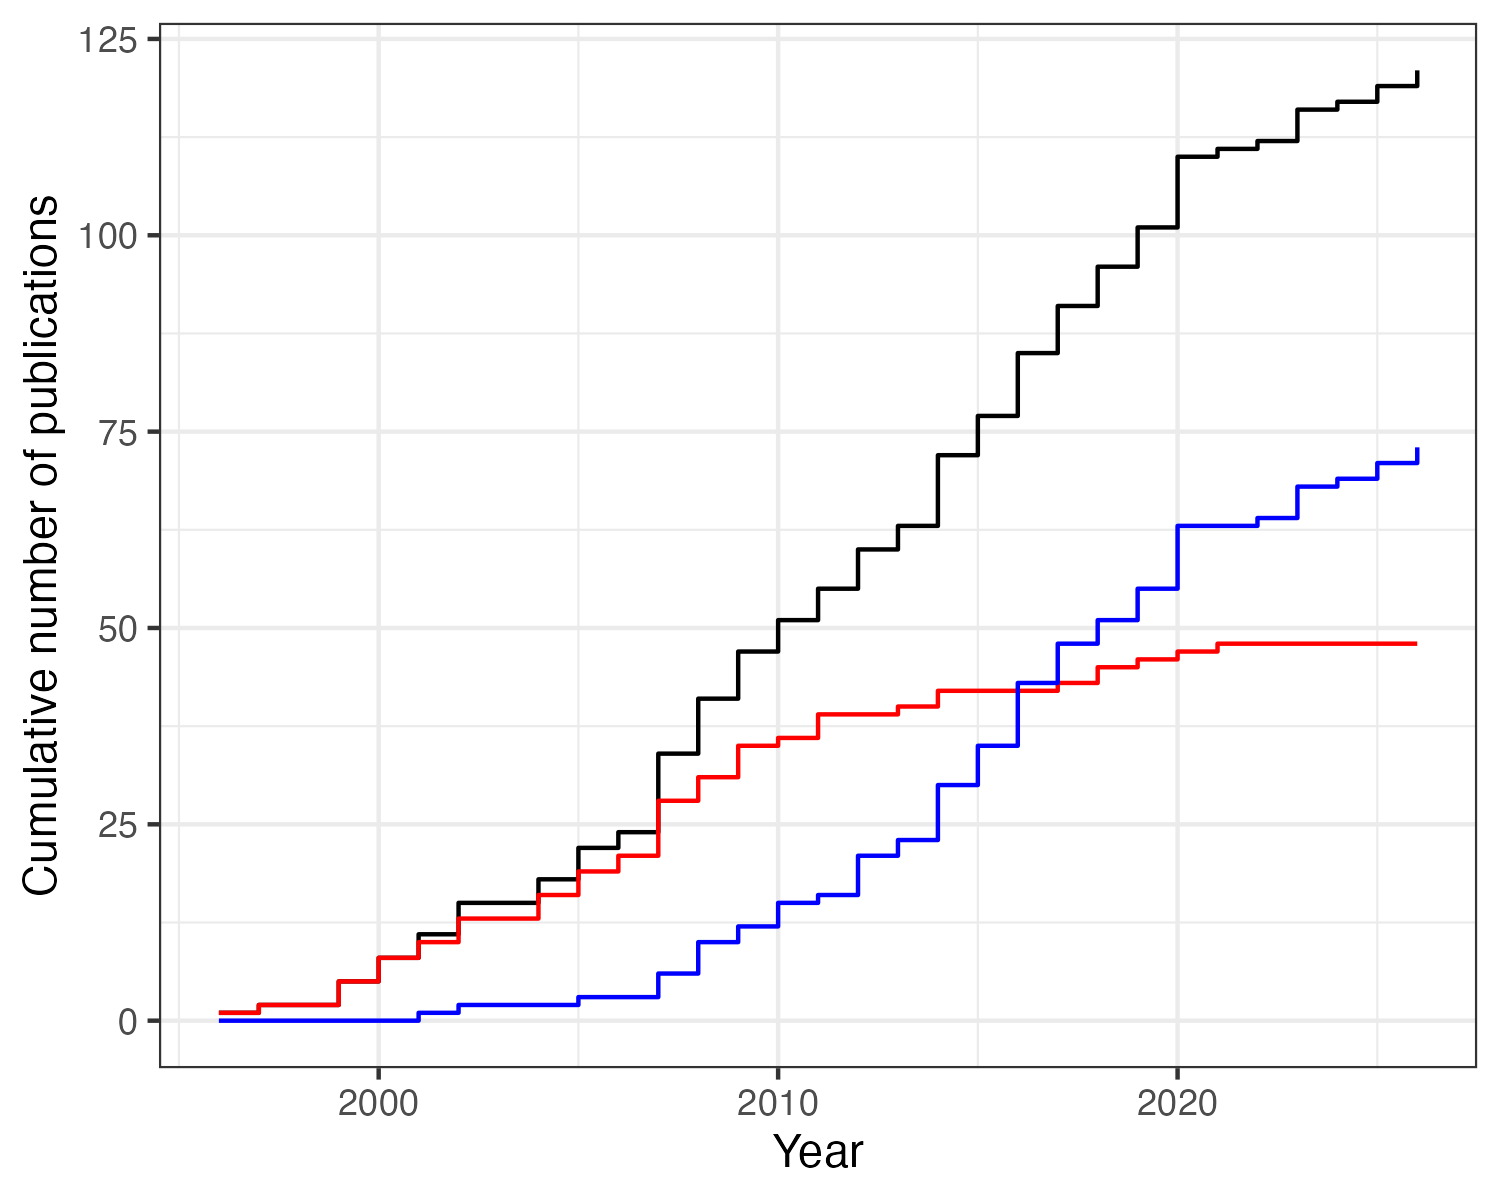
Cumulative publications over time (yellow line shows mollusc papers, blue line shows non-mollusc papers, black line shows all papers):
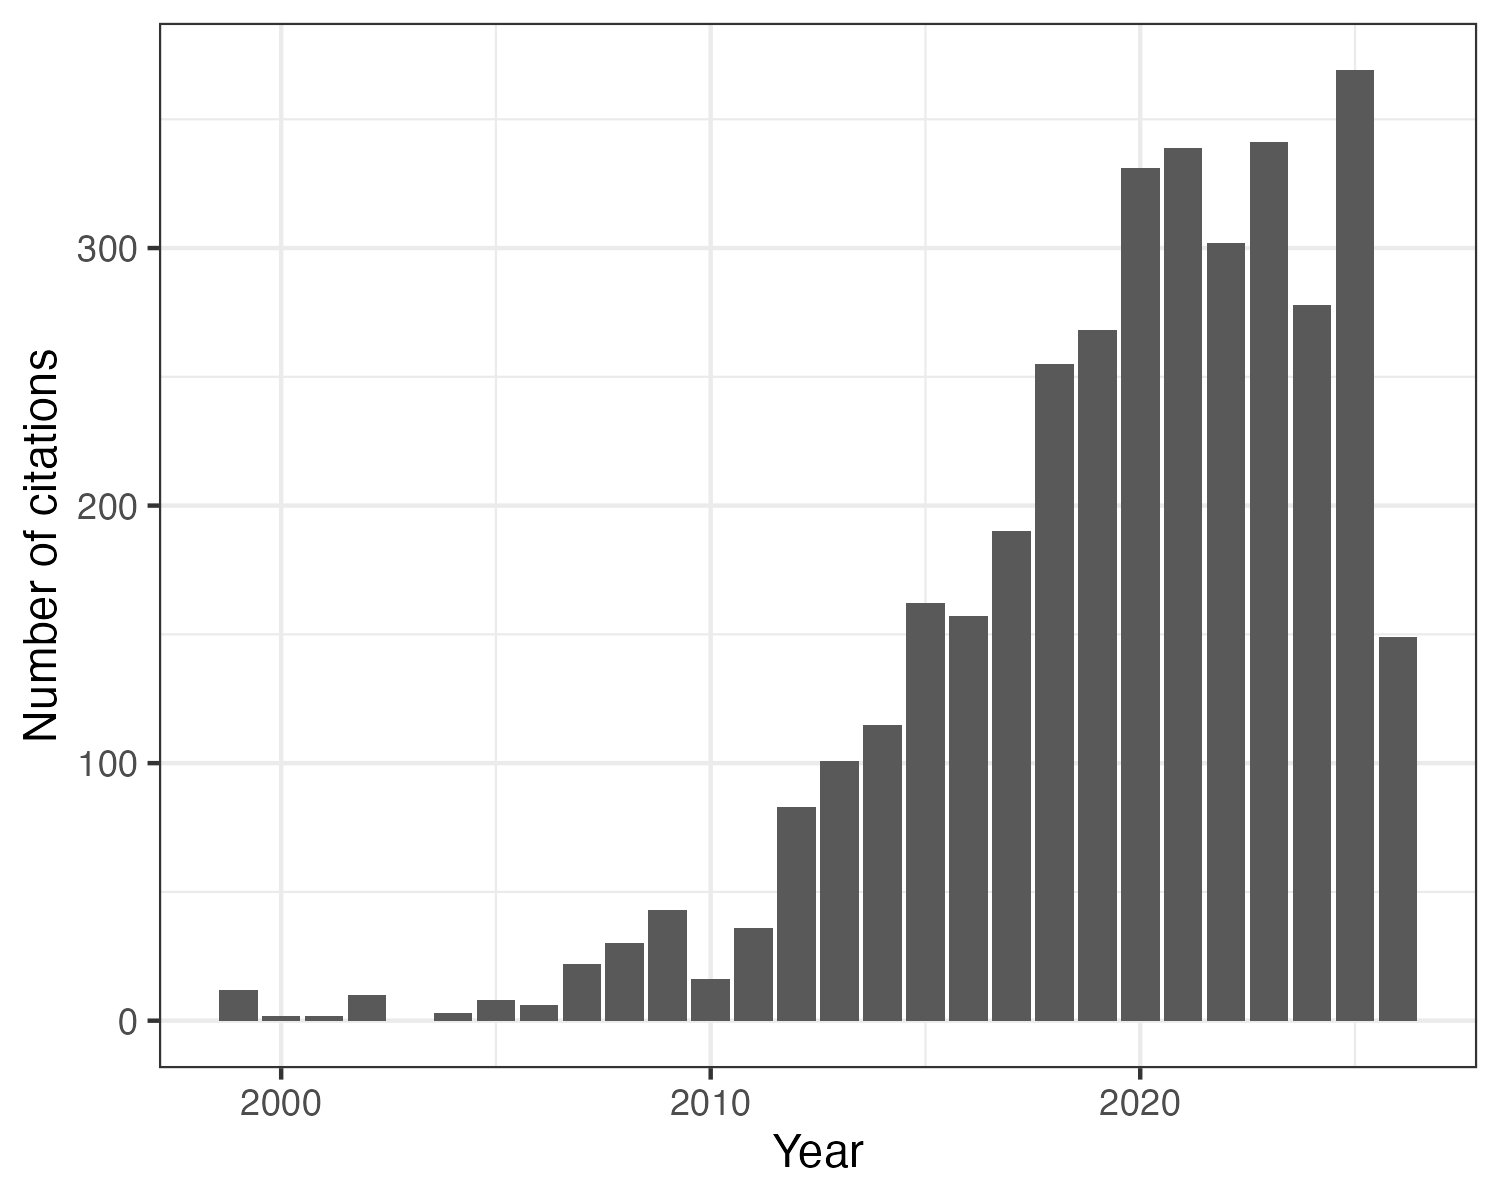
Citations over time:
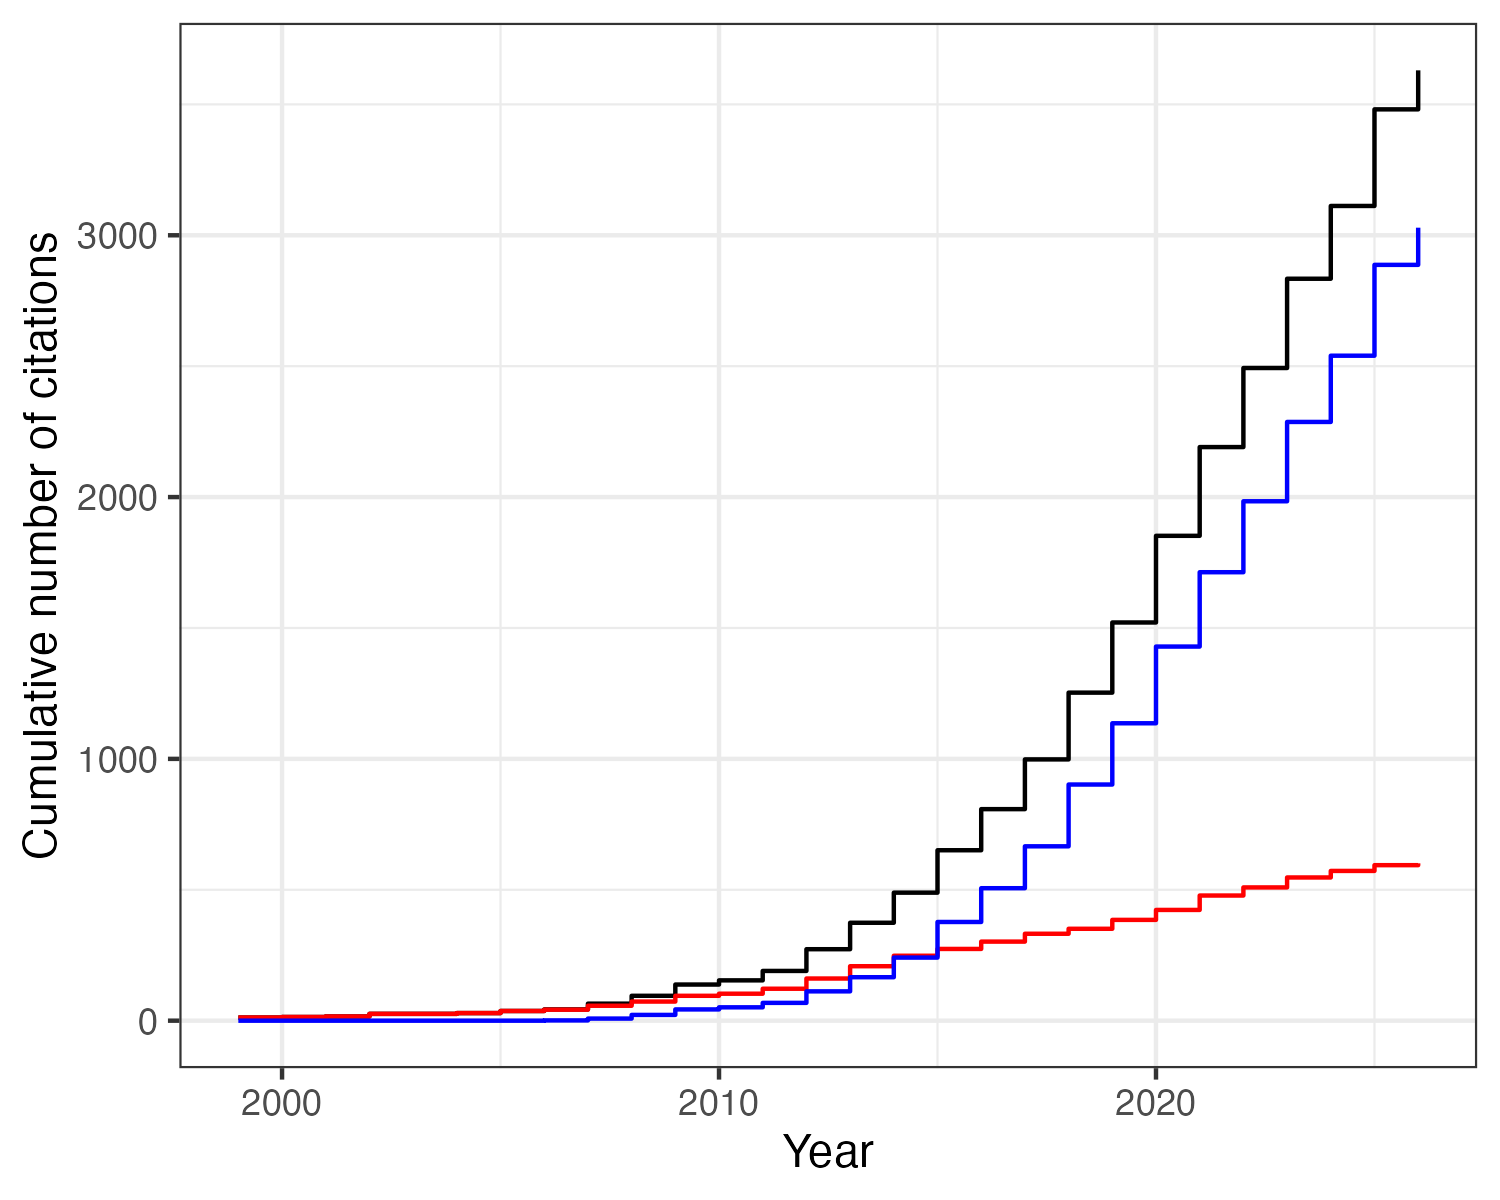
Cumulative citations over time (yellow line shows mollusc papers, blue line shows non-mollusc papers, black line shows all papers):
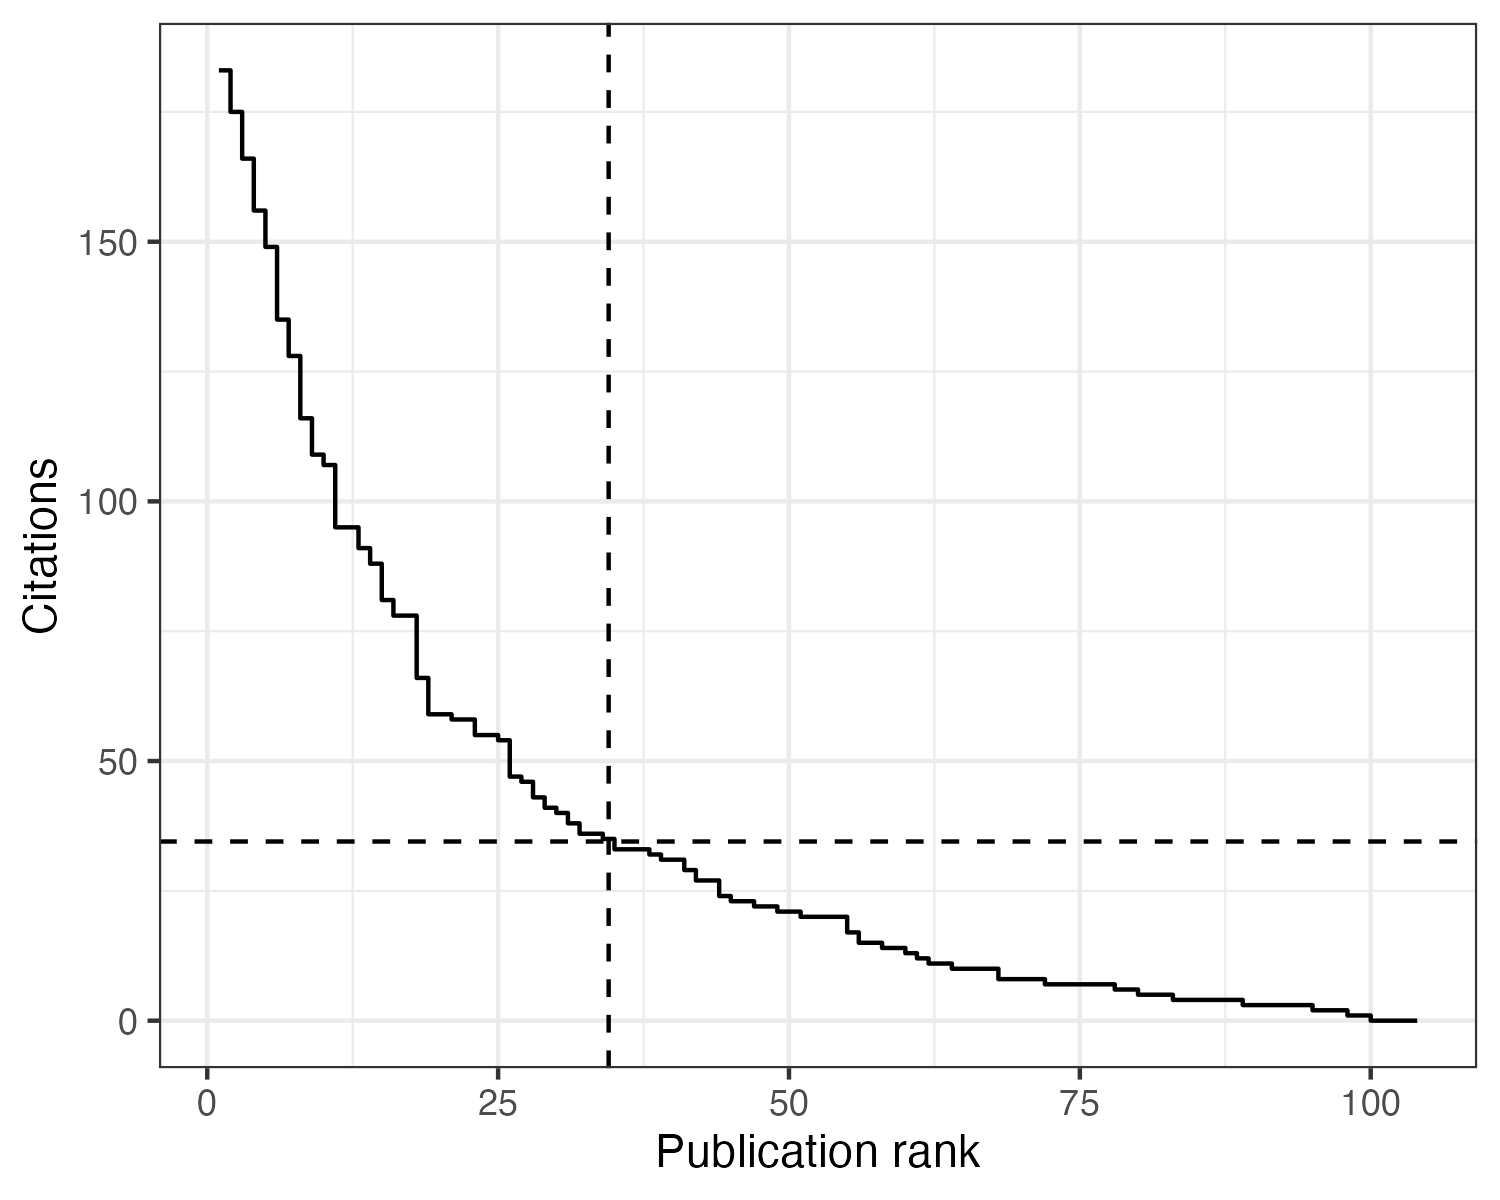
H-index:
Closing the gap between data and decision making
Analyzing Ecological Data with Detection Error
This course is for researchers who analyze field observations. These data are often inconsistent because sampling protocols can change across projects, over time, or when older data are combined with new recordings.
- CalgaryR & YEGRUG Meetup: Data Cloning - Hierarchical Models Made Easy
- How many birds are out there?
- Fitting removal models with the detect R package
- Shiny slider examples with the intrval R package
- Phylogeny and species traits predict bird detectability
ABMI (7) ARU (1) Alberta (1) BAM (1) C (1) CRAN (1) Hungary (2) JOSM (2) MCMC (2) PVA (2) PVAClone (1) QPAD (3) R (21) R packages (1) abundance (1) bioacoustics (1) biodiversity (1) birds (2) course (2) data (1) data cloning (4) datacloning (1) dclone (3) density (1) dependencies (1) detect (3) detectability (4) footprint (3) forecasting (1) functions (3) intrval (4) lhreg (1) mefa4 (1) monitoring (2) pbapply (5) phylogeny (1) plyr (1) poster (2) processing time (2) progress bar (4) publications (2) report (1) sector effects (1) shiny (1) single visit (1) site (1) slider (1) slides (2) special (3) species (1) trend (1) tutorials (2) video (4) workshop (2)