How many birds are out there?
June 22, 2020 Etc abundance density detectability QPAD Alberta ABMI BAM
In a recent paper entitled “Lessons learned from comparing spatially explicit models and the Partners in Flight approach to estimate population sizes of boreal birds in Alberta, Canada” we developed improved, spatially explicit models for 81 land bird species in northern Alberta, Canada. We then compared these estimates of bird abundance to a commonly-used but non-spatially explicit estimate by Partners in Flight (PIF v 3.0) that’s based on the North American Breeding Bird Survey (BBS) data set. The publication is a result of years of collaboration between the ABMI, Boreal Avian Modelling (BAM) project, Canadian Wildlife Service (Environment and Climate Change Canada), and United States Geological Survey.
The paper represents a major step forwards in understanding the complexity of population size estimation. We paid special attention to framing the implications for conservation and management of species at risk and for improving future data collection. It was published in the Condor, and it is open access:
- publication: https://doi.org/10.1093/condor/duaa007
- supporting information: http://doi.org/10.5281/zenodo.3563112
Here is the abstract:
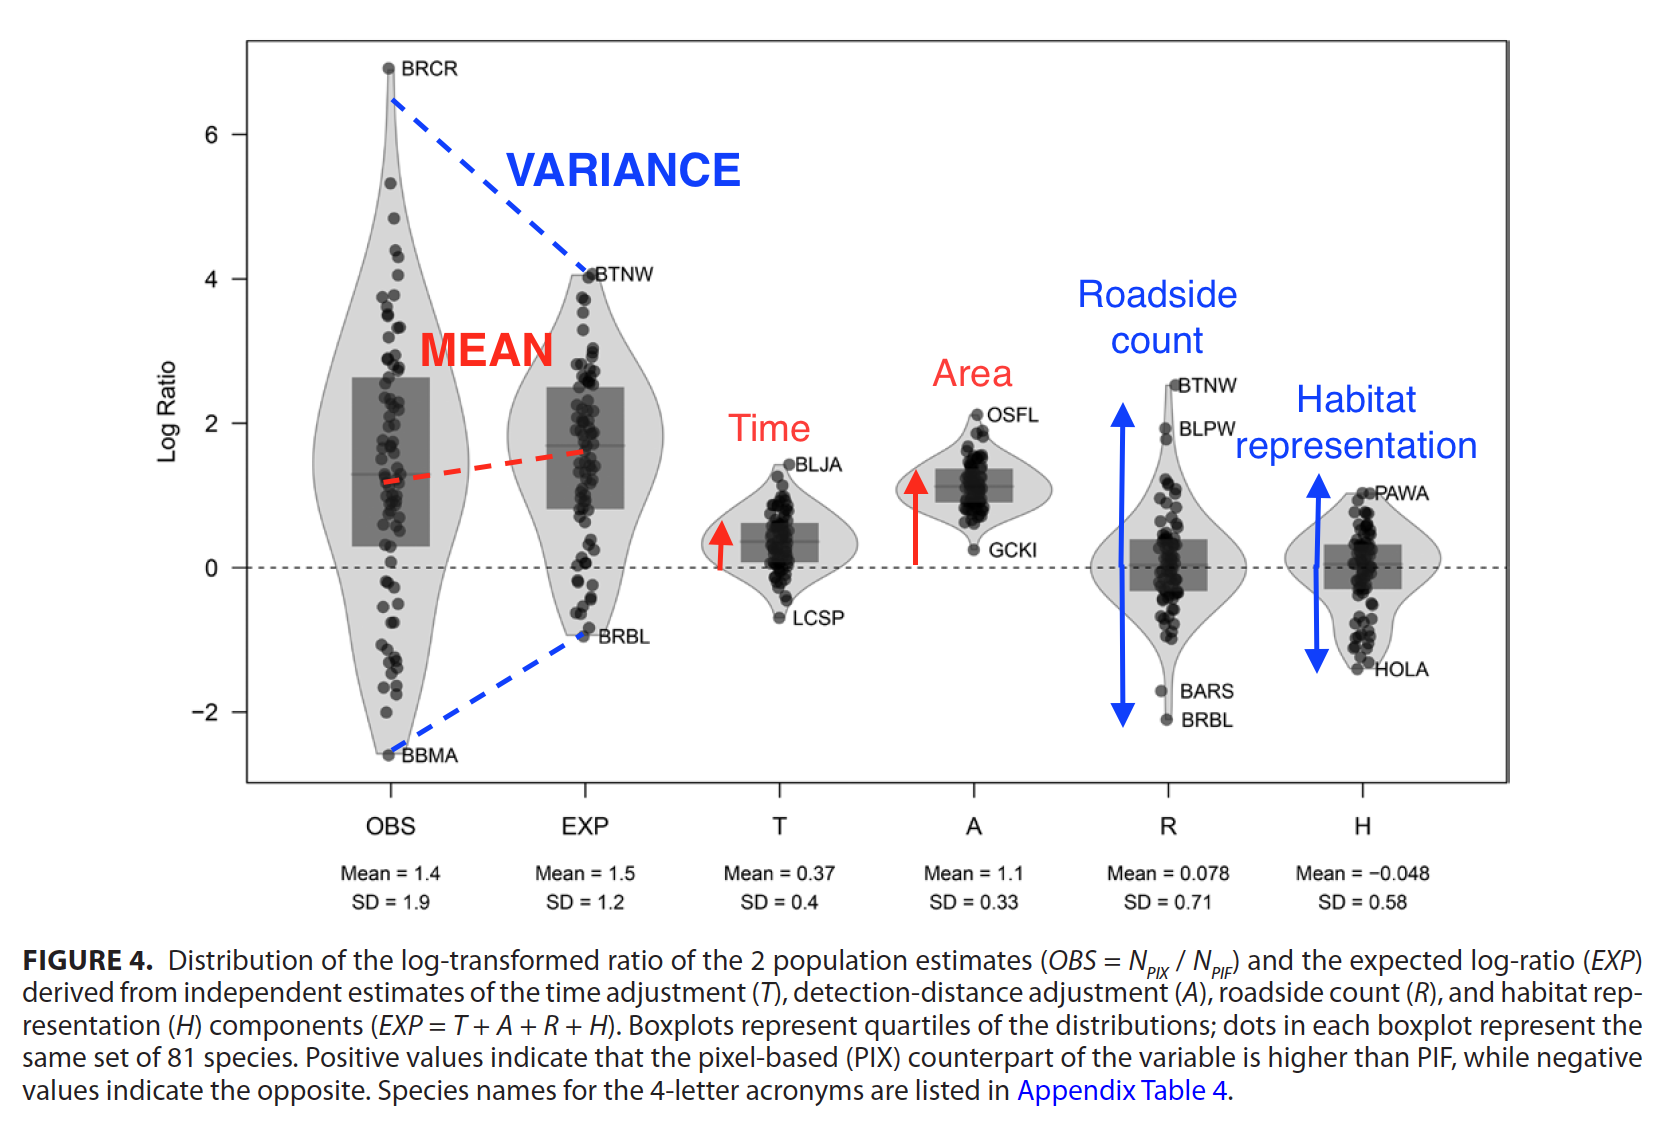
Estimating the population abundance of landbirds is a challenging task complicated by the amount, type, and quality of available data. Avian conservationists have relied on population estimates from Partners in Flight (PIF), which primarily uses roadside data from the North American Breeding Bird Survey (BBS). However, the BBS was not designed to estimate population sizes. Therefore, we set out to compare the PIF approach with spatially explicit models incorporating roadside and off-road point-count surveys. We calculated population estimates for 81 landbird species in Bird Conservation Region 6 in Alberta, Canada, using land cover and climate as predictors. We also developed a framework to evaluate how the differences between the detection distance, time-of-day, roadside count, and habitat representation adjustments explain discrepancies between the 2 estimators. We showed that the key assumptions of the PIF population estimator were commonly violated in this region, and that the 2 approaches provided different population estimates for most species. The average differences between estimators were explained by differences in the detection-distance and time-of-day components, but these adjustments left much unexplained variation among species. Differences in the roadside count and habitat representation components explained most of the among-species variation. The variation caused by these factors was large enough to change the population ranking of the species. The roadside count bias needs serious attention when roadside surveys are used to extrapolate over off-road areas. Habitat representation bias is likely prevalent in regions sparsely and non-representatively sampled by roadside surveys, such as the boreal region of North America, and thus population estimates for these regions need to be treated with caution for certain species. Additional sampling and integrated modeling of available data sources can contribute towards more accurate population estimates for conservation in remote areas of North America.
I am not going to provide another perspective here, but rather, I list all the other sources out there that I wrote in connection with the paper, or commentaries that arose in news outlets.
Blog posts:
- Three things you should know about population estimation, the AOS blog
- Made in Alberta models help continental bird conservation, the ABMI blog
In the news:
Presentations:
Social activity on Altmetric:
Closing the gap between data and decision making
Analyzing Ecological Data with Detection Error
This course is for researchers who analyze field observations. These data are often inconsistent because sampling protocols can change across projects, over time, or when older data are combined with new recordings.
- Analyzing Ecological Data with Detection Error
- Fitting removal models with the detect R package
- Phylogeny and species traits predict bird detectability
- Effects of industrial sectors on species abundance in Alberta
- NACCB 2016 talk on cumulative effects monitoring
ABMI (7) ARU (1) Alberta (1) BAM (1) C (1) CRAN (1) Hungary (2) JOSM (2) MCMC (2) PVA (2) PVAClone (1) QPAD (3) R (21) R packages (1) abundance (1) bioacoustics (1) biodiversity (1) birds (2) course (2) data (1) data cloning (4) datacloning (1) dclone (3) density (1) dependencies (1) detect (3) detectability (4) footprint (3) forecasting (1) functions (3) intrval (4) lhreg (1) mefa4 (1) monitoring (2) pbapply (5) phylogeny (1) plyr (1) poster (2) processing time (2) progress bar (4) publications (2) report (1) sector effects (1) shiny (1) single visit (1) site (1) slider (1) slides (2) special (3) species (1) trend (1) tutorials (2) video (4) workshop (2)