Plot methods
plot.RdPlot methods for different bSims objects.
Usage
# S3 method for class 'bsims_landscape'
plot(x,
  col_H, col_E, col_R,
  xlim = NULL, ylim = NULL, ...)

# S3 method for class 'bsims_population'
plot(x,
  pch_nest, col_nest, cex_nest, ...)

# S3 method for class 'bsims_events'
plot(x,
  event_type=c("vocal", "move", "both"), tlim = NULL,
  pch_nest, col_nest, cex_nest,
  pch_vocal, col_vocal, cex_vocal,
  lty_move, col_move, lwd_move, ...)

# S3 method for class 'bsims_detections'
plot(x,
  event_type=NULL, tlim = NULL,
  pch_nest, col_nest, cex_nest,
  pch_vocal, col_vocal, cex_vocal,
  lty_move, col_move, lwd_move,
  lty_det_vocal, col_det_vocal, lwd_det_vocal,
  lty_det_move, col_det_move, lwd_det_move,
  condition = "event1", ...)

# S3 method for class 'bsims_transcript'
plot(x,
  pch_nest, col_nest, cex_nest,
  pch_vocal, col_vocal, cex_vocal,
  lty_move, col_move, lwd_move,
  lty_det_vocal, col_det_vocal, lwd_det_vocal,
  lty_det_move, col_det_move, lwd_det_move,
  show_tint=TRUE, show_rint=TRUE,
  col_tint, col_rint, ...)

# S3 method for class 'bsims_events'
lines(x, tlim = NULL, ...)
# S3 method for class 'bsims_detections'
lines(x,
  event_type=NULL, tlim=NULL, condition="event1", ...)
# S3 method for class 'bsims_transcript'
lines(x,
  event_type=NULL, tlim=NULL, ...)

# S3 method for class 'bsims_population'
points(x, ...)
# S3 method for class 'bsims_events'
points(x,
  event_type=c("vocal", "move", "both"), tlim = NULL, ...)
# S3 method for class 'bsims_detections'
points(x,
  event_type=NULL, tlim=NULL, condition="event1", ...)

col2hex(col, alpha = FALSE)

# S3 method for class 'bsims_events_table'
plot(x,
  xlab, ylab, xlim, ylim, col_det_vocal, col_det_move, ...)
# S3 method for class 'bsims_detections_table'
plot(x,
  type=c("time", "distance"), xlab, ylab, xlim, ylim,
  col_det_vocal, col_det_move, ...)
Arguments
- x
simulation object.
- col
color values.
- col_H, col_E, col_R
color values for the Habitat, Edge, and Road strata.
- event_type
type of events to access. The value is inferred from the input object when
NULL.- xlim, ylim, tlim
x, y, time intervals.
- xlab, ylab
x and y axis labels.
- pch_nest, col_nest, cex_nest
visual characteristics of nest locations.
- pch_vocal, col_vocal, cex_vocal
visual characteristics of vocalization events.
- lty_move, col_move, lwd_move
visual characteristics of movement events.
- lty_det_vocal, col_det_vocal, lwd_det_vocal
visual characteristics of detection events related to vocalizations.
- lty_det_move, col_det_move, lwd_det_move
visual characteristics of detection events related to movements.
- alpha
alpha channel for colors.
- show_tint, show_rint
whether time and distance intervals should be displayed.
- col_tint, col_rint
colors for time and distance intervals.
- condition
conditioning type to define availability for each individual, see
bsims_detect.- type
what the x axis should be: time or distance.
- ...
other graphical arguments.
Details
The main plotting functions use a theme defined in
the option getOption("bsims_theme").
Overriding these default settings allows customization.
Value
These plotting functions are called for their side effects and silently return the input object.
col2hex is modeled after col2rgb
and returns a character vector giving hexadecimal color codes with
or without alpha channel values.
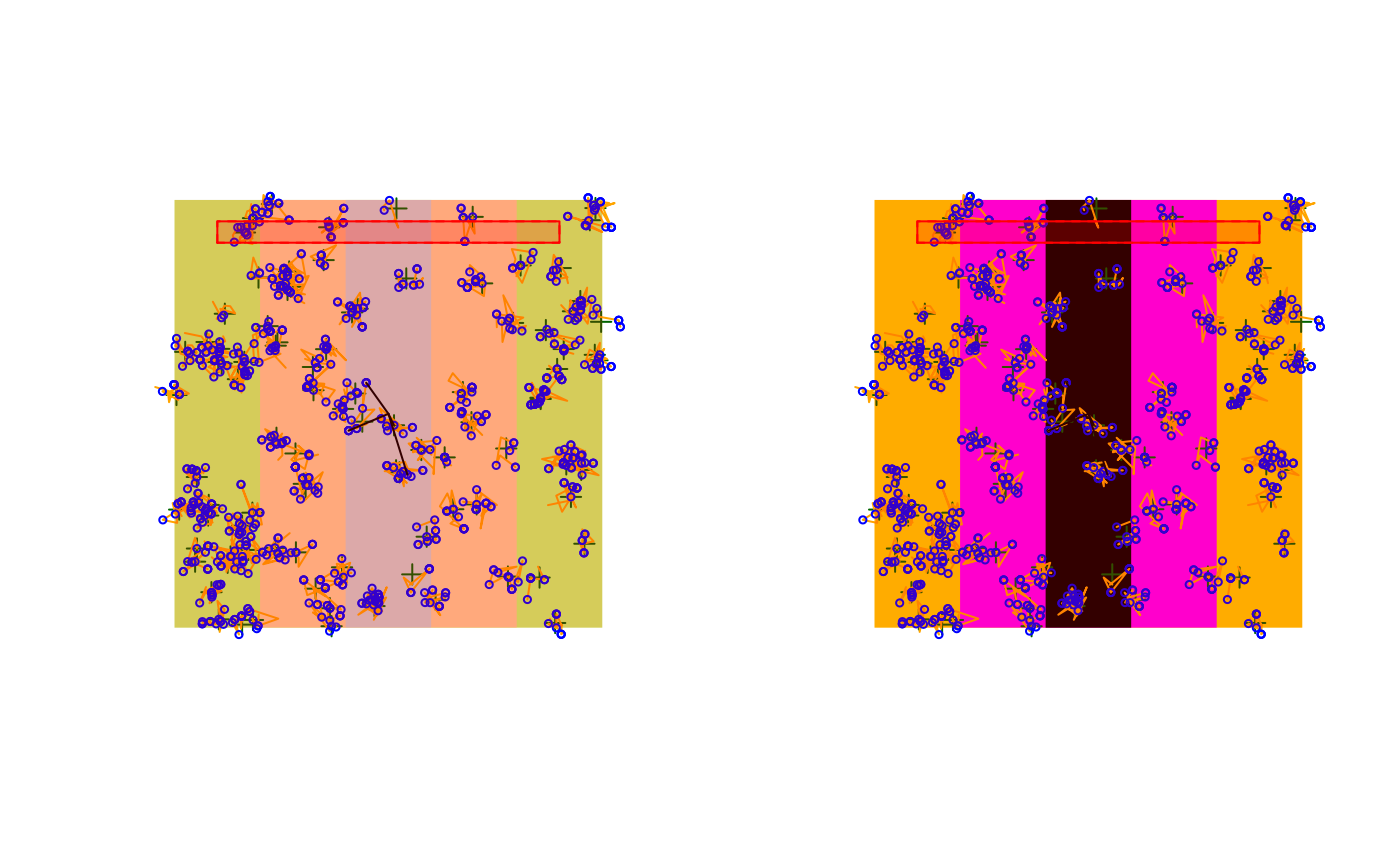
Examples
b <- bsims_all(road=1, edge=2, move_rate=1, movement=0.2)$new()
o <- getOption("bsims_theme")
str(o)
#> List of 20
#>  $ col_H        : chr "darkolivegreen1"
#>  $ col_E        : chr "burlywood1"
#>  $ col_R        : chr "lightgrey"
#>  $ col_nest     : chr "darkgreen"
#>  $ pch_nest     : num 3
#>  $ cex_nest     : num 1
#>  $ col_vocal    : chr "blue"
#>  $ pch_vocal    : num 21
#>  $ cex_vocal    : num 0.5
#>  $ col_move     : chr "orange"
#>  $ lty_move     : num 1
#>  $ lwd_move     : num 1
#>  $ col_det_vocal: chr "black"
#>  $ lty_det_vocal: num 1
#>  $ lwd_det_vocal: num 1
#>  $ col_det_move : chr "purple"
#>  $ lty_det_move : num 1
#>  $ lwd_det_move : num 1
#>  $ col_tint     : chr "red"
#>  $ col_rint     : chr "red"
n <- o
n$col_H <- "gold"
n$col_E <- "magenta"
n$col_R <- "black"
op <- par(mfrow=c(1, 2))
plot(b)
options("bsims_theme" = n) # apply new theme
plot(b)

par(op)
options("bsims_theme" = o) # reset old theme

col2hex(c(blu = "royalblue", reddish = "tomato"), alpha = FALSE)
#>       blu   reddish
#> "#4169E1" "#FF6347"
col2hex(c(blu = "royalblue", reddish = "tomato"), alpha = TRUE)
#>         blu     reddish
#> "#4169E1FF" "#FF6347FF"
par(op)
options("bsims_theme" = o) # reset old theme
col2hex(c(blu = "royalblue", reddish = "tomato"), alpha = FALSE)
#> blu reddish
#> "#4169E1" "#FF6347"
col2hex(c(blu = "royalblue", reddish = "tomato"), alpha = TRUE)
#> blu reddish
#> "#4169E1FF" "#FF6347FF"