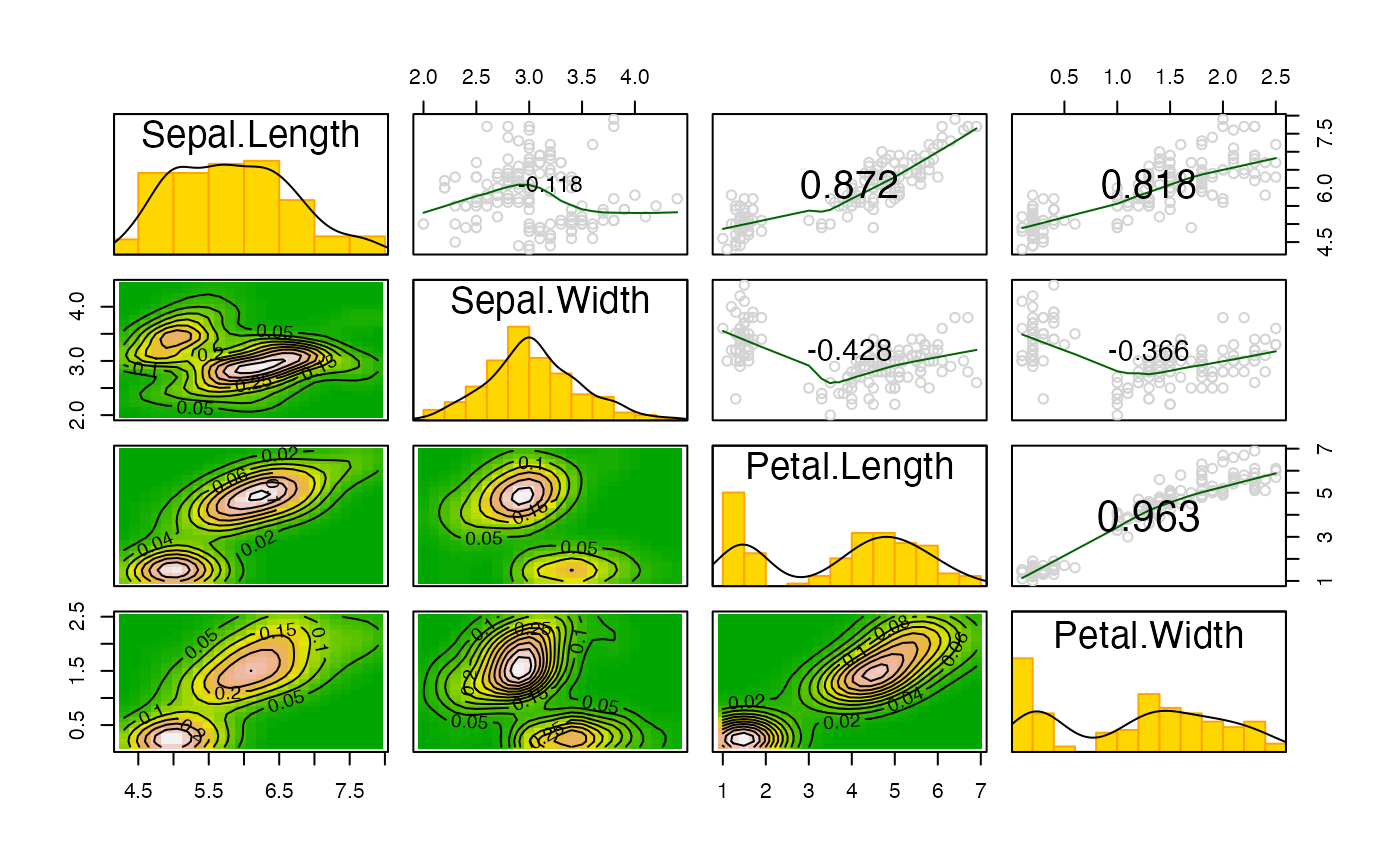
Scatterplot Matrix with 2D Kernel Density
kdepairs.RdScatterplot matrix with 2D kernel density.
Usage
kdepairs(x, ...)

# Default S3 method
kdepairs(x, n=25, density=TRUE, contour=TRUE, ...)

# S3 method for class 'rsf'
kdepairs(x, n=25, density=TRUE, contour=TRUE, ...)
Arguments
- x
a matrix or data frame (or a fitted model object of class
"rsf"or"rspf").- n
number of bins to be used in kernel density estimation.
- density
logical, if shades corresponding to densities should be plotted.
- contour
logical, if contour on top of shades should be plotted.
- ...
other possible arguments passed to
pairs.